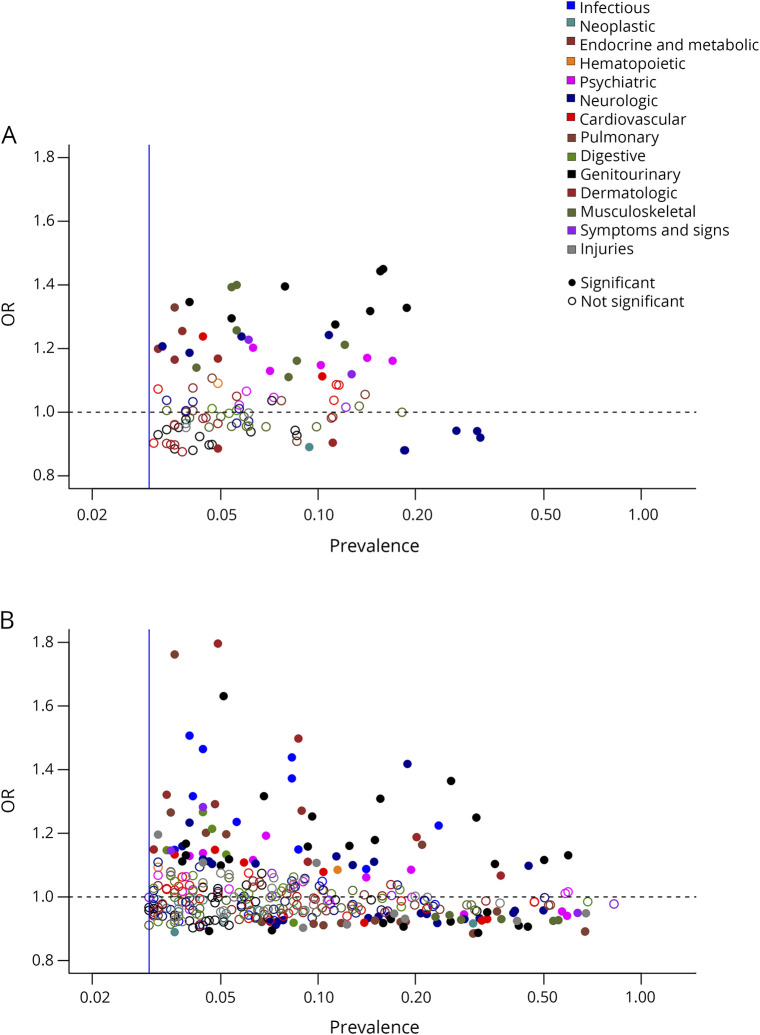
Figure 4. Plot of estimated OR and cohort prevalence for mapped coexisting medical conditions associated with higher MS severity scores (MSSS).
Findings from independent analysis in the discovery cohort (A) and extension cohort (B). Results below the dotted lines are inverse associations. ORs represent per unit increase of the MSSS (on the decile scale).

