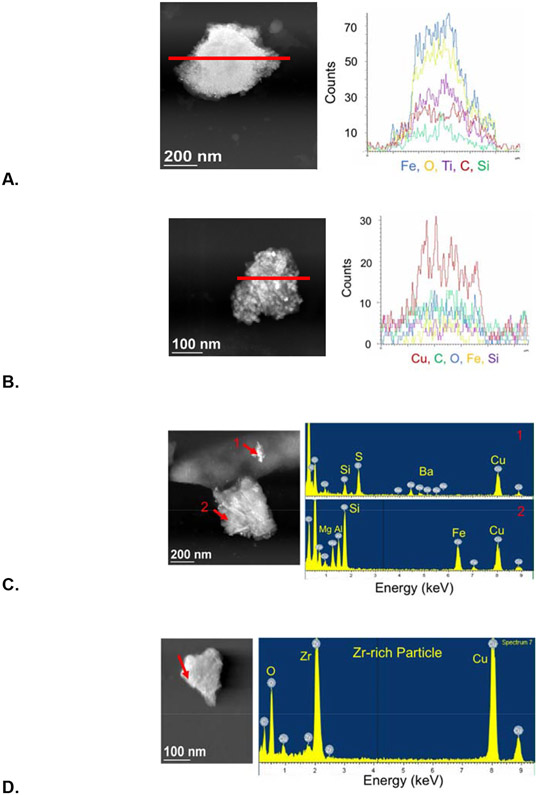
Figure 5.
Scanning transmission electron microscopy (STEM) image and energy dispersive spectrometry (EDS) line scan (red line) or point analysis (red arrow) of: A. Fe-oxide and Ti-rich particle with C and Si; B. Aggregate particle with high Cu, C and Si, and relatively low Fe; C. Two particles, (1) one with Ba and S, likely BaSO4, and Cu, and (2) one with Fe, Cu, and Si, and lower amounts of Mg and Al; D. Zr- and O- rich particle, likely ZrO2, with Cu.

