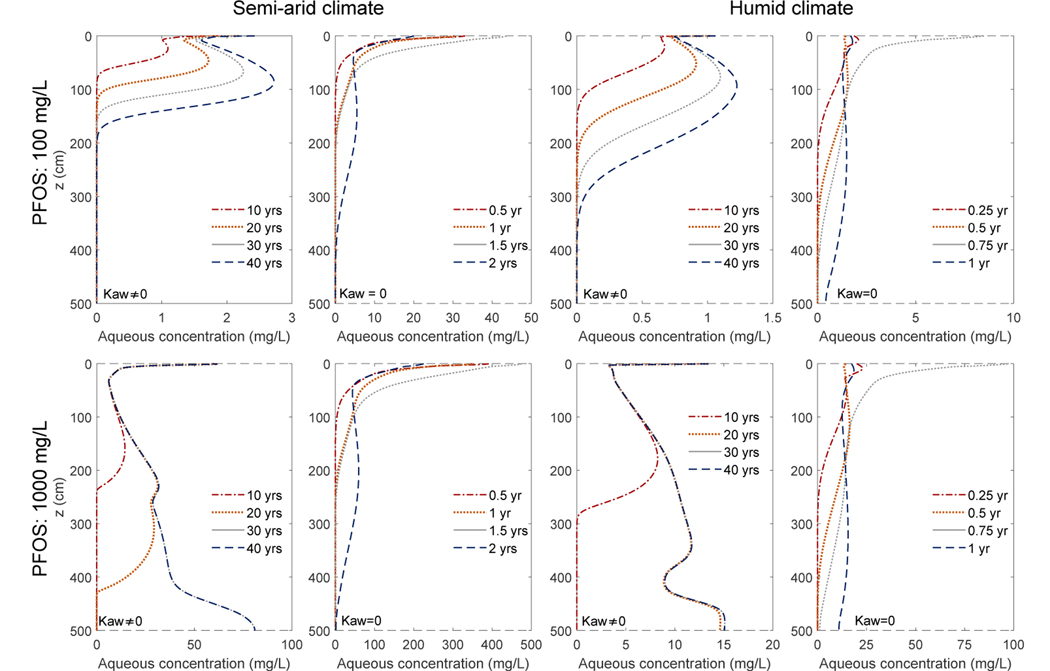
Figure 5:
Simulated temporal evolution of the PFOS aqueous concentration profiles over 40 years in a vadose zone beneath an FTA site consisting of the Accusand. The first and second rows are simulations with a PFOS concentration of 100 mg/L and 1000 mg/L, respectively. The first two columns are under a semi-arid climate. The third and fourth columns are under a humid climate. The first and third columns are with air-water interfacial adsorption, while the second and fourth columns are without air-water interfacial adsorption.

