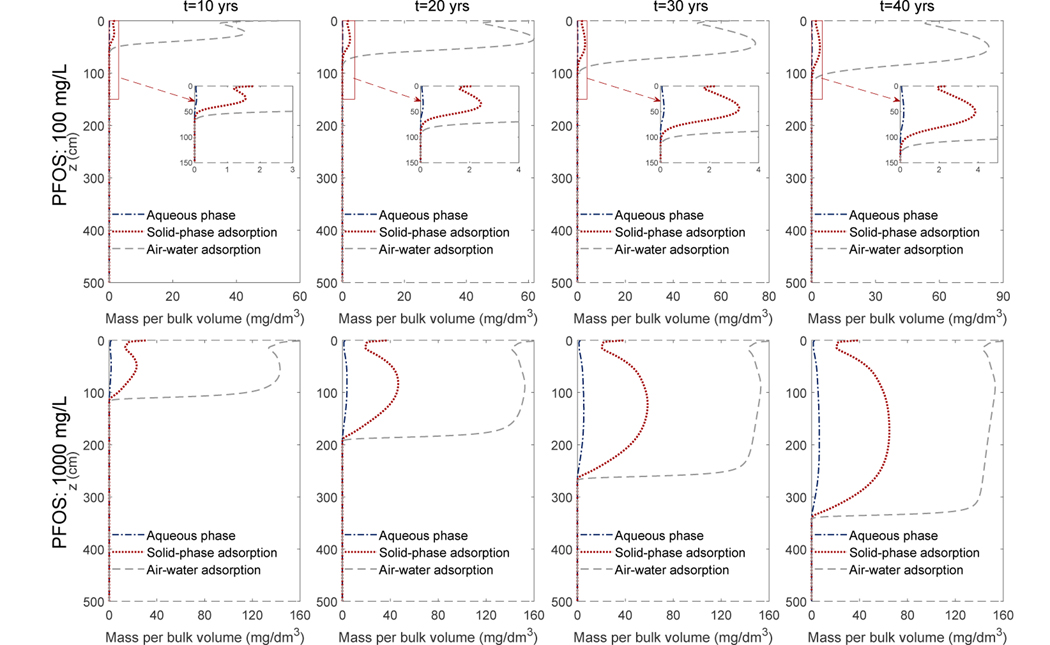
Figure 9:
The four columns are the profiles of the PFOS mass per bulk volume of the porous medium for the Vinton under the semi-arid climate scenario soil at 10, 20, 30, 40 years, respectively. The first and second rows are simulations with PFOS concentration of 100 mg/L and 1000 mg/L, respectively.

