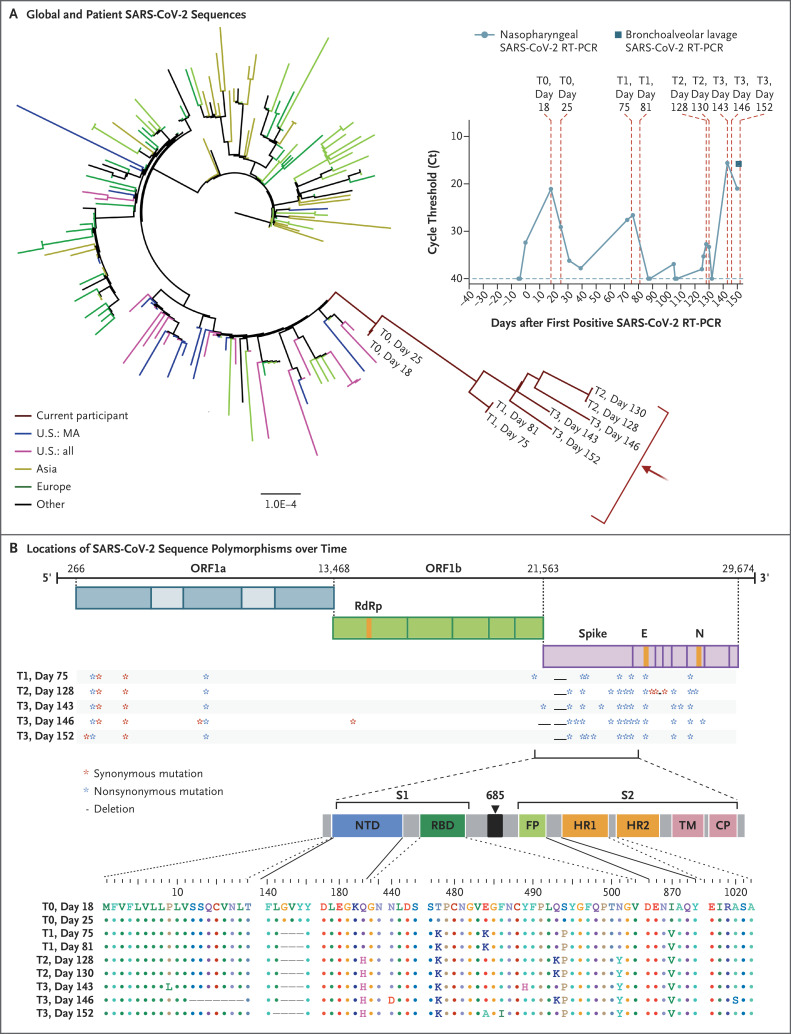
Figure 1. SARS-CoV-2 Whole-Genome Viral Sequencing from Longitudinally Collected Nasopharyngeal Swabs.
Shown in Panel A is a maximum-likelihood phylogenetic tree with patient sequences (red arrow) at four time points with high levels of SARS-CoV-2 viral loads (T0 denotes days 18 and 25; T1 days 75 and 81; T2 days 128 and 130; and T3 days 143, 146, and 152), along with representative sequences from the state (U.S.: MA), country (U.S.: all), Asia, Europe, and Other (Africa, South America, and Canada). The scale represents 0.0001 nucleotide substitutions per site. The inset shows nasopharyngeal and bronchoalveolar-lavage SARS-CoV-2 RT-PCR cycle threshold (Ct) values; the horizontal dashed line represents the cutoff for positivity at 40, and vertical red dashed lines represent days of viral sequencing (days 18, 25, 75, 81, 128, 130, 143, 146, and 152). Shown in Panel B are the locations of deletions and synonymous and nonsynonymous mutations in the patient at T1, T2, and T3 as compared with T0. CP denotes cytoplasmic domain, E envelope, FP fusion peptide, HR1 heptad repeat 1, HR2 heptad repeat 2, N nucleocapsid, NTD N-terminal domain, ORF open reading frame, RBD receptor-binding domain, RdRp RNA-dependent RNA polymerase, S1 subunit 1, S2 subunit 2, and TM transmembrane domain.

