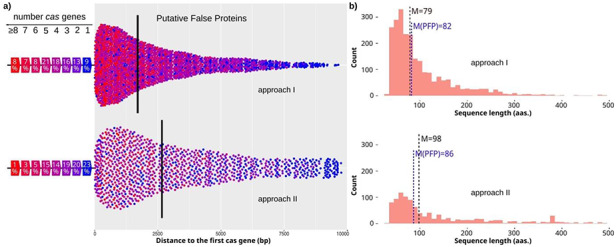
Figure 3.

Characteristics of candidates with cas genes nearby. (a) Distances from candidates to the closest cas gene for approach I and II (top and bottom, respectively). The color of the dot shows the number of cas genes found close to the candidate. The percentage of candidates found close to a specific number of cas genes is shown on the left. Median value is shown by a vertical line. (b) Length distribution of candidates for approach I and II (top and bottom, respectively). The median value is highlighted for all candidates with one or more cas genes (M), and for the final PFPs (M(PFP) in blue color).
