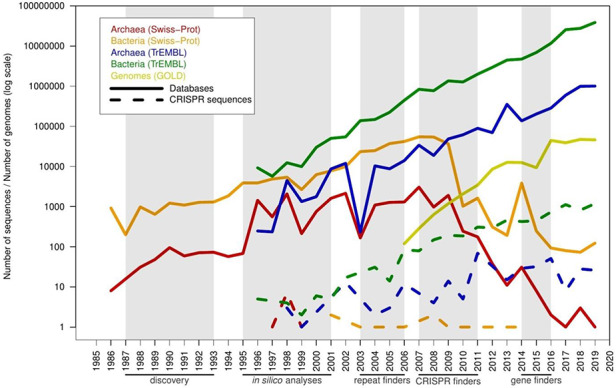
Figure 5.

Timeline with the number of predicted spurious proteins by year of creation, compared with the pace of new proteins and genomes in the databases. The x-axis shows years from 1985 to 2019. A series of milestones are highlighted below the x-axis (and shaded in gray color): discovery of CRISPR sequences (discovery), initial computational analyses of these sequences (in silico analyses), prediction of CRISPR sequences using unspecific computational tools designed for searching tandem repeats (repeat finders), CRISPR-specific computational tools such as CRT and CRISPRFinder (CRISPR finders) and inclusion of CRISPR prediction in genomic gene finders such as Prokka, PGAP and RAST (gene finders). Solid lines represent database growth, and dashed lines represent misannotated sequences.
