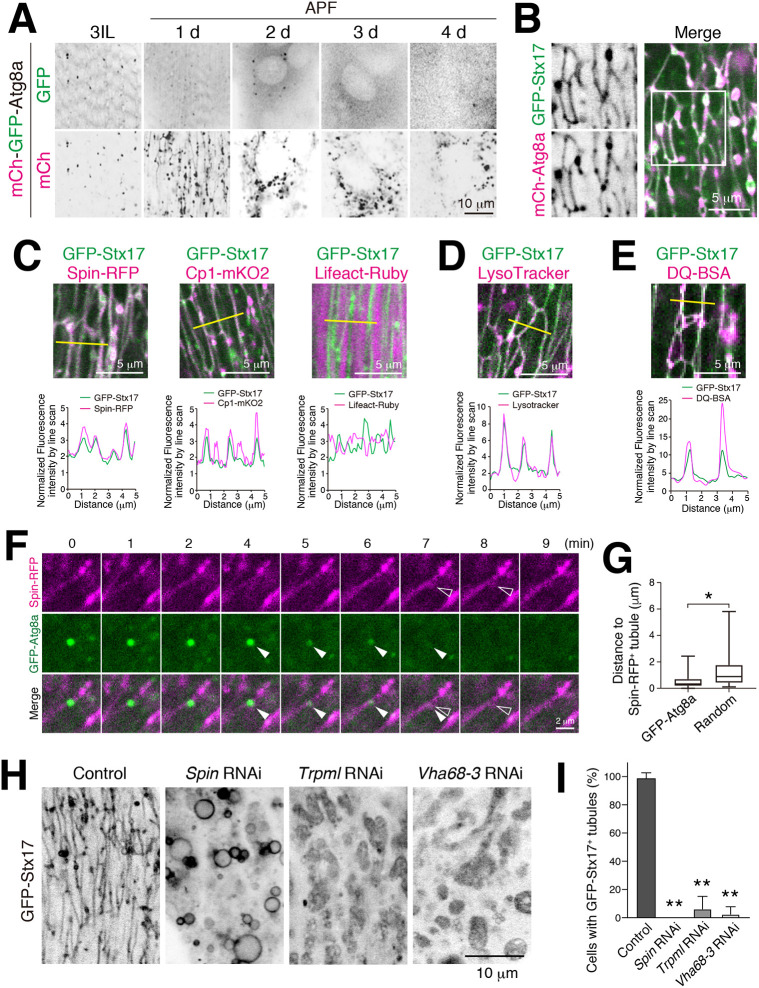
Fig. 2.
The Syntaxin17 tubular network has characteristics of autolysosomes. (A) Timecourse microscopy of mCherry–GFP–Atg8a in DIOM imaged through the cuticle of live animals from 3IL to 4 d APF. (B) Colocalization between GFP–Stx17 and mCherry–Atg8a in 20 h APF DIOM. Box in the merge image indicates region shown as separate fluorescence channels on the left. (C) Colocalization between GFP–Stx17 and Spin–RFP, Cp1–mKO2 or Lifeact–Ruby in 20 h APF DIOMs. Line plot profiles of the yellow line in each panel are shown. (D,E) Live pupae were injected with LysoTracker Red (D) or DQ Red–BSA (E), and DIOMs were imaged through the cuticle at 20 h APF. Line plot profiles of the yellow line in each panel are shown. (F) Time-lapse imaging of Spin–RFP and GFP–Atg8a in 20 h APF DIOMs. Disappearing GFP punctum, white arrowheads; shape change of tubular lysosome, open arrowheads. (G) Quantification of the distance between a Spin–RFP-positive tubule and the point at which GFP–Atg8a puncta disappeared (GFP:Atg8) or randomly drawn puncta (random). n>30. Boxes show the interquartile range, with the median indicated. Whiskers show the maximum and minimum values. *P<0.05 (Student's t-test). (H,I) GFP–Stx17 localization in DIOMs at 20 h APF from control, spin RNAi, Trpml RNAi or Vha68-3 RNAi-treated animals. (H) Representative images of GFP–Stx17 localization. (I) Mean+s.d. percentage of DIOMs with more than 5 µm GFP–Stx17-positive tubules, n=10. **P<0.001 (Dunnett's test).

