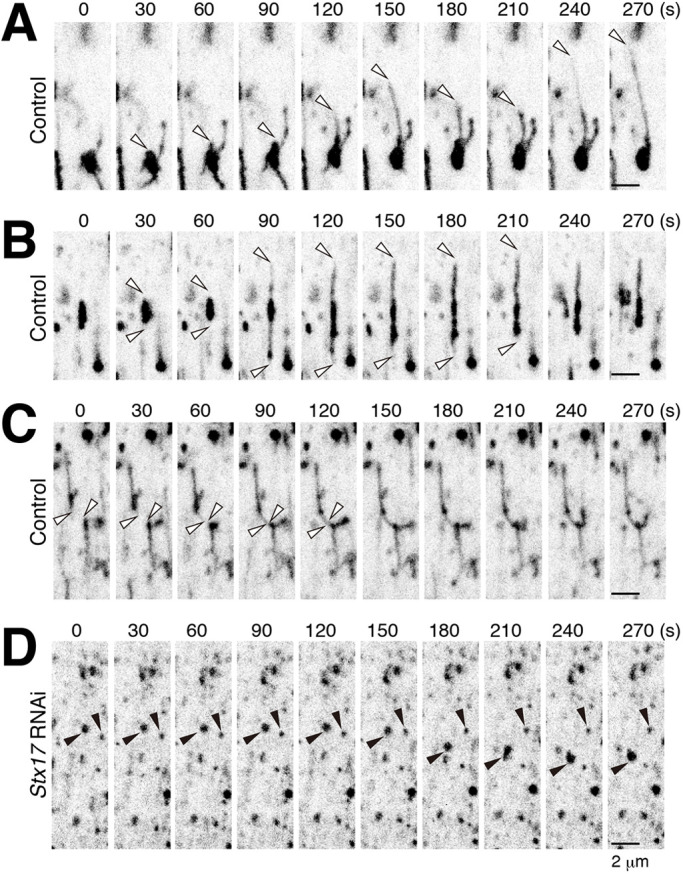
Fig. 5.

Dynamics of the tAL network formation. (A–C) Time-lapse imaging of Spin–RFP in control DIOMs around 14 h APF. White arrowheads indicate the tips of elongating tubules. (D) Time-lapse imaging of Spin–RFP in Stx17 RNAi DIOM around 14 h APF. Black arrowheads indicate Spin–RFP-positive puncta. Tubulation was not observed in the Stx17 RNAi condition.
