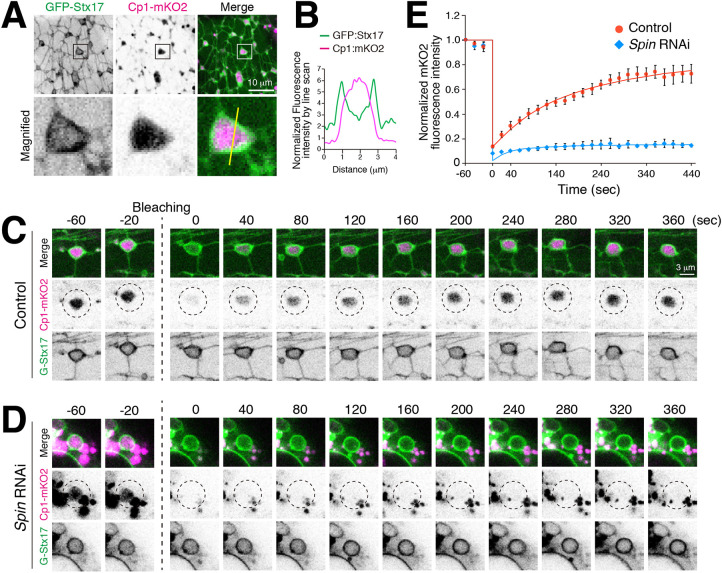
Fig. 7.
The tubulated autolysosome lumen is continuous and intermixed. (A) Colocalization of GFP–Stx17 and Cp1–mKO2 in 24 h APF DIOM. Boxes indicate the region shown in magnified images below. Line indicates the line section shown in B. (B) Line plot profiles of the yellow line in panel A. (C,D) FRAP analysis of Cp1–mKO2 in 24 h APF DIOMs of control (C) or spin RNAi (D) animals. Dashed circle indicates region of photobleaching. (E) Quantification of C and D. The mean±s.d. is shown, n=5.

