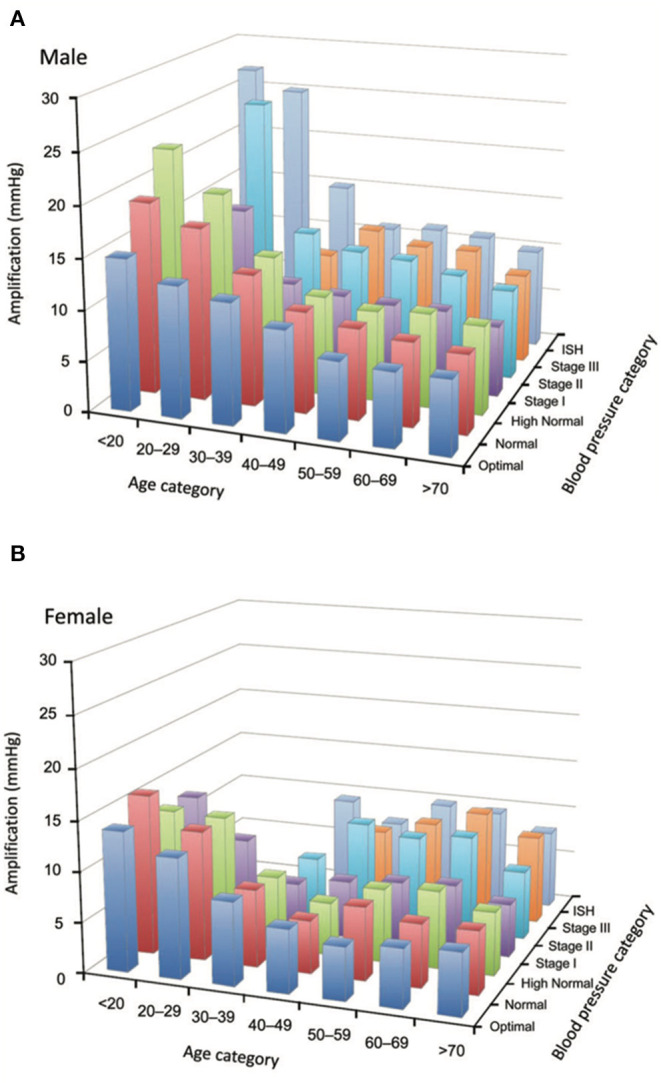
Figure 3.

(A,B) Loss of amplification phenomenon in the elderly. Tridimensional bar-graphs representing amplification according to sex (6a, males; 6b, females), age categories, and blood pressure categories. The value represented here is the median of the group. Some categories are not represented because there were <50 observations. From Herbert et al. (32) with permission.
