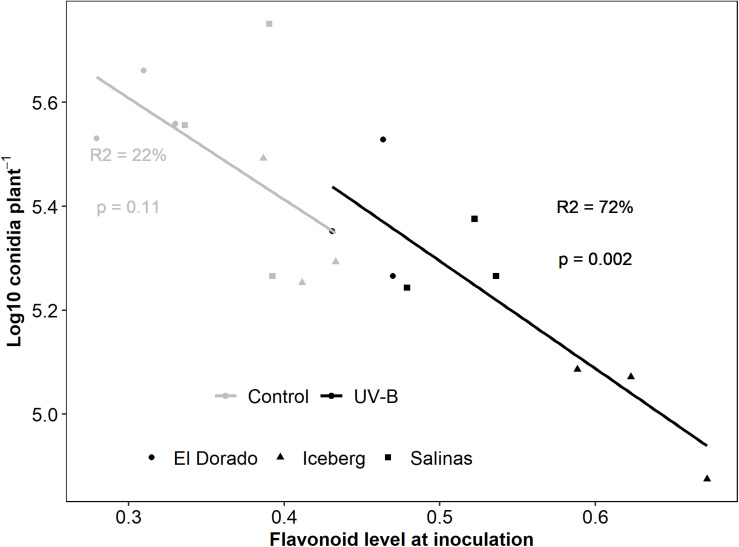
FIGURE 3.
log10 Conidia count of B. lactucae decreases as flavonoid level of infected lettuce (L. sativa) plants increases. Lettuce plants were treated with photosynthetically active radiation (PAR) + 0.5 μmol m– 2 s– 1 UV-B or PAR only (control) for 3 days. Following treatment plants were non-destructively measured for flavonoids using a Dualex and then inoculated with 105 conidia mL– 1 of B. lactucae. At 12 days post-inoculation, plants were washed in water and the resulting conidia suspension was counted using a hemocytometer (n = 9). UV-B-pre-treated plants (black points) drive this response with the regression (line) lost when control (gray points) are considered separately. Cultivars are indicated by point shape (El Dorado = circle, Iceberg = diamond, Salinas = square). Regression fit is indicated by the R2 values and model significance by p-value with text color indicating treatment (control = gray, UV-B = black)

