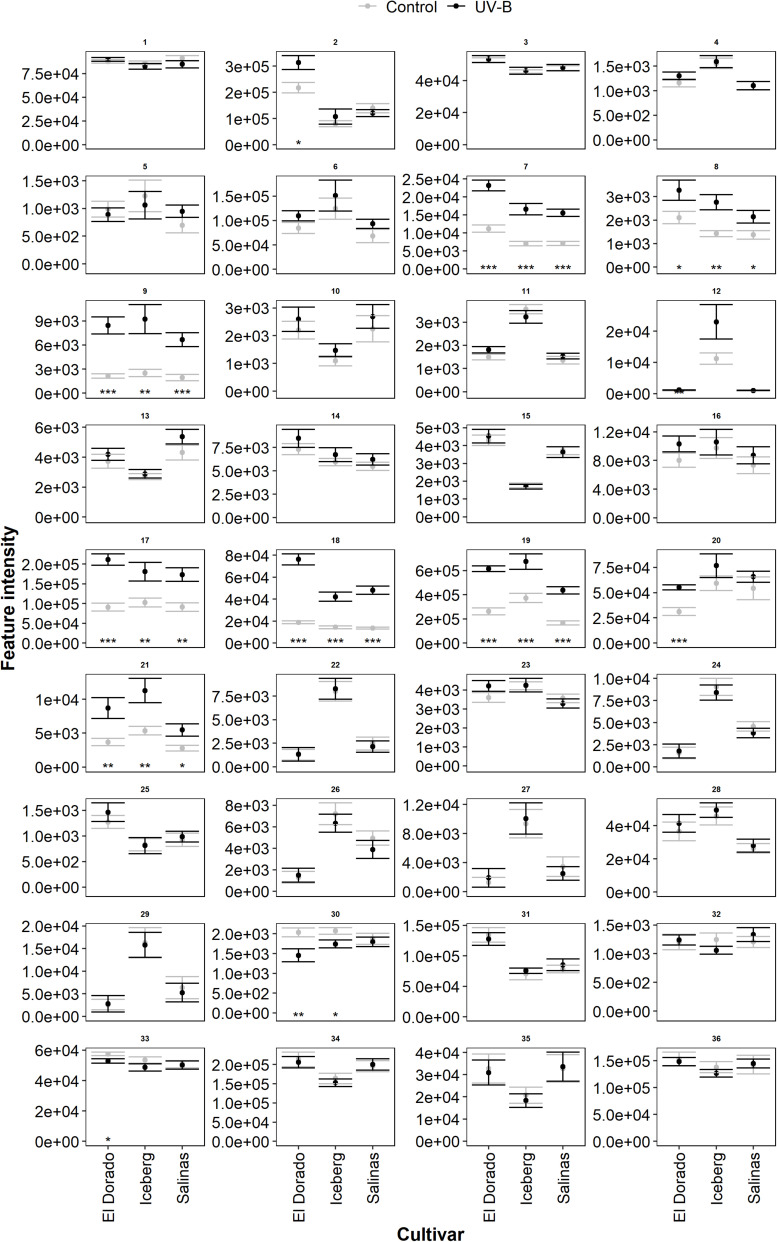
FIGURE 4.
Mean intensity of all metabolomic features (Supplementary Table 1) in UV-B (black) and control (gray) plants of lettuce (L. sativa) cv.; El Dorado, Iceberg, and Salinas (n = 9). Plants were treated with photosynthetically active radiation (PAR)+UV-B or PAR only (control) for 3 days. Following treatment, samples were extracted for liquid chromatography–mass spectrometry (LC-MS) analysis. Significant differences between UV-B and control plants of each feature (panel) are indicated by asterisks (t-test, *p < 0.05, **p < 0.005, ***p < 0.0005). Error bars are 1 SE.

