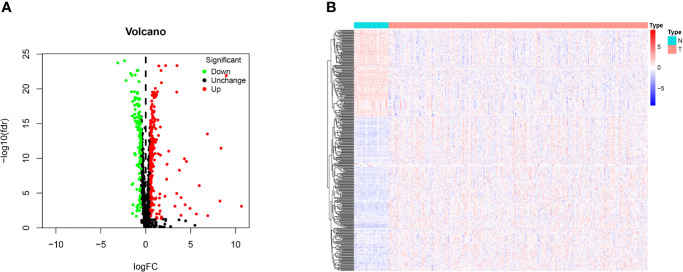
Figure 1.
Identification of differentially expressed RNA binding proteins (DE RBPs) in TCGA dataset and enrichment analysis. (A) Volcano plot of all DE RBPs between HCC and normal samples, 208 were up-regulated and 122 were down-regulated. Red: up-regulated RBPs; Black: unchanged RBPs; Green: down-regulated RBPs. (B) Heat map of the DE RBPs based on their expression data log2 transformed FPKM values. The red represents high expression, and the green represents low expression.

