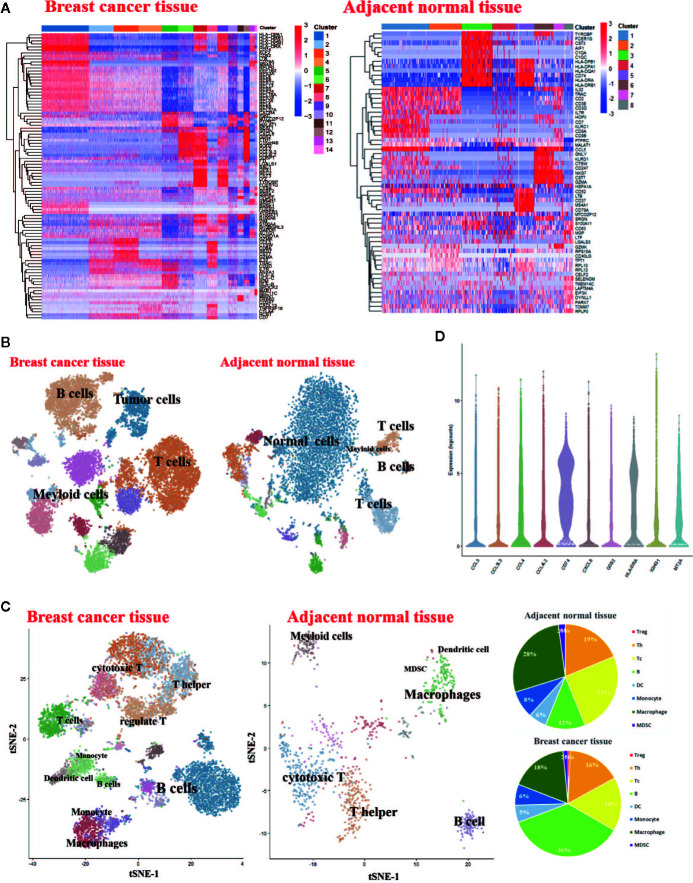
Figure 1.
Single-Cell RNA-Seq Experimental Initial Data Exploration (A) Heatmap of log counts of genes in signature. (B) t-SNE of complete cells isolated from the breast cancer tissue and matched adjacent normal breast tissue. (C) t-SNE of CD45+ cells isolated from the breast cancer tissue and matched normal breast tissue (Left). Pie charts of cell-type fractions for the patient’s tumor-infiltrating immune cells, colored by cell type (Right). (D) The violin plot shows the top 10 most variable genes among different cells in the breast cancer sample.

