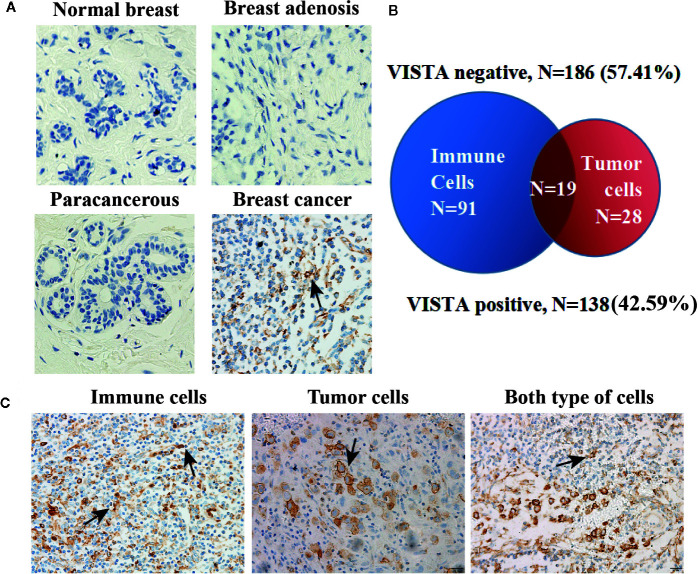
Figure 3.
VISTA expression pattern in human breast cancer tissue. (A) Representative immunohistochemical staining for the VISTA protein in normal breast tissue (n=4), breast adenosis tissue (n=2), paracancerous tissue (n=13) and breast cancer tissue (n=324). Original magnification, 400 ×. (B) The expression of VISTA in breast cancer detected by immunohistochemistry. VISTA negative (n=186, 57.41%) vs. VISTA positive (n=138, 42.59%). (C) Representative positive VISTA staining in immune cells (110/324, 33.95%), tumor cells (47/324, 14.51%), and both types of cells (19/324, 5.86%). Original magnification, 200 ×.

