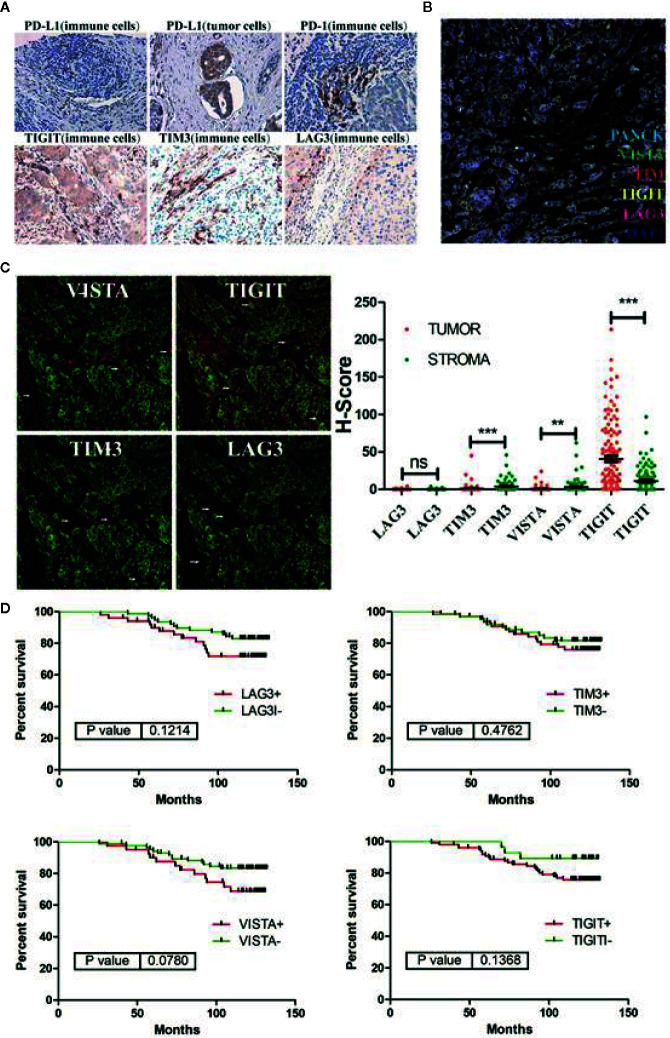
Figure 5.
(A) Representative immunohistochemical staining for immune checkpoint molecules (PD-L1, PD-1, TIGIT, TIM3 and LAG3) in breast cancer samples. (B) Representative multiplex immunofluorescence staining for immune checkpoint molecules (VISTA, TIGIT, TIM3 and LAG3) in breast cancer samples. VISTA staining is shown in green; TIGIT staining is shown in yellow; TIM3 staining is shown in red; LAG3 staining is shown in magenta; PANCK staining is shown in cyan; and DAPI staining is shown in blue. (C) Co-localization of PANCK with VISTA, TIGIT, TIM3 and LAG3 in breast cancer detected by immunofluorescence. VISTA, TIGIT, TIM3, LAG3 staining is shown in red; PANCK staining is shown in green; and DAPI staining is shown in blue. (D) Kaplan-Meier curves showing overall survival (OS) of breast cancer patients based on immune-checkpoints (VISTA, TIGIT, TIM3 and LAG3) status. **p < 0.01, ***p < 0.001. NS, no significance.

