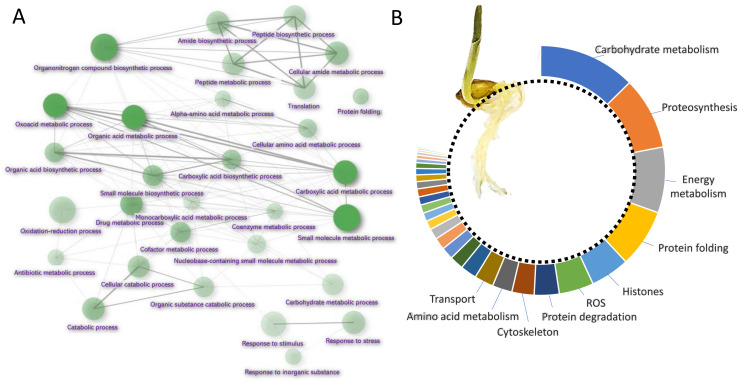
FIGURE 1.
Barley root proteome composition. (A) Enrichment analysis based on hypergeometric distribution followed by FDR correction. Two pathways are connected if they share 20% or more proteins. Darker and bigger nodes are more significantly enriched and larger sets, respectively. Analyzed by ShinyGO 0.61 (Ge et al., 2020); (B) The function of the most abundant proteins representing 80% of the barley root proteome. For the sake of clarity, only ten most abundant categories are labeled.

