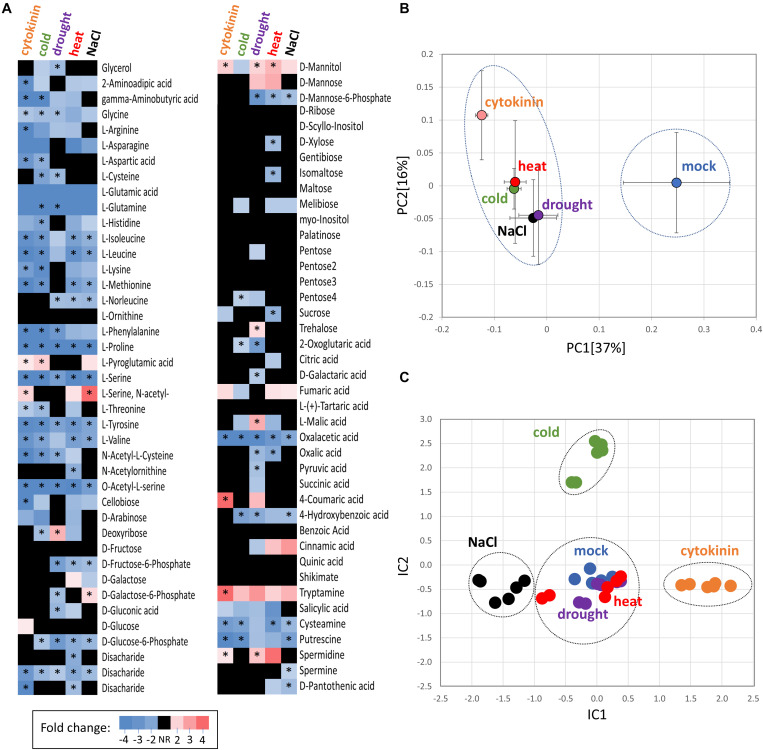
FIGURE 4.
Comparison of cytokinin- and abiotic stress-induced changes in roots of barley. (A) Heat map visualization of detected root metabolites. Asterisks indicate statistically significant changes (p < 0.05); (B) Similarities in the average metabolome composition visualized by PCA. Presented data are means and standard error (n = 6); (C) Clusters of treatments obtained from independent component analysis of protein profiles; Dashed circles represent statistically significant separation (Kruskal-Wallis test, p < 0.05).

