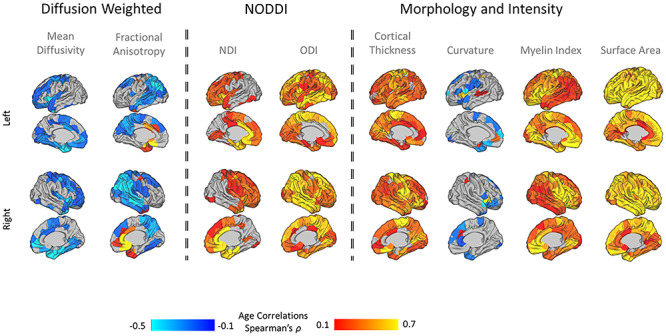
Figure 2.

Association between single-feature maps (n = 150 parcels) and age at scan: Positive correlations are marked in red and negative correlations in blue. NDI, neurite density index; ODI, orientation dispersion index.

Association between single-feature maps (n = 150 parcels) and age at scan: Positive correlations are marked in red and negative correlations in blue. NDI, neurite density index; ODI, orientation dispersion index.