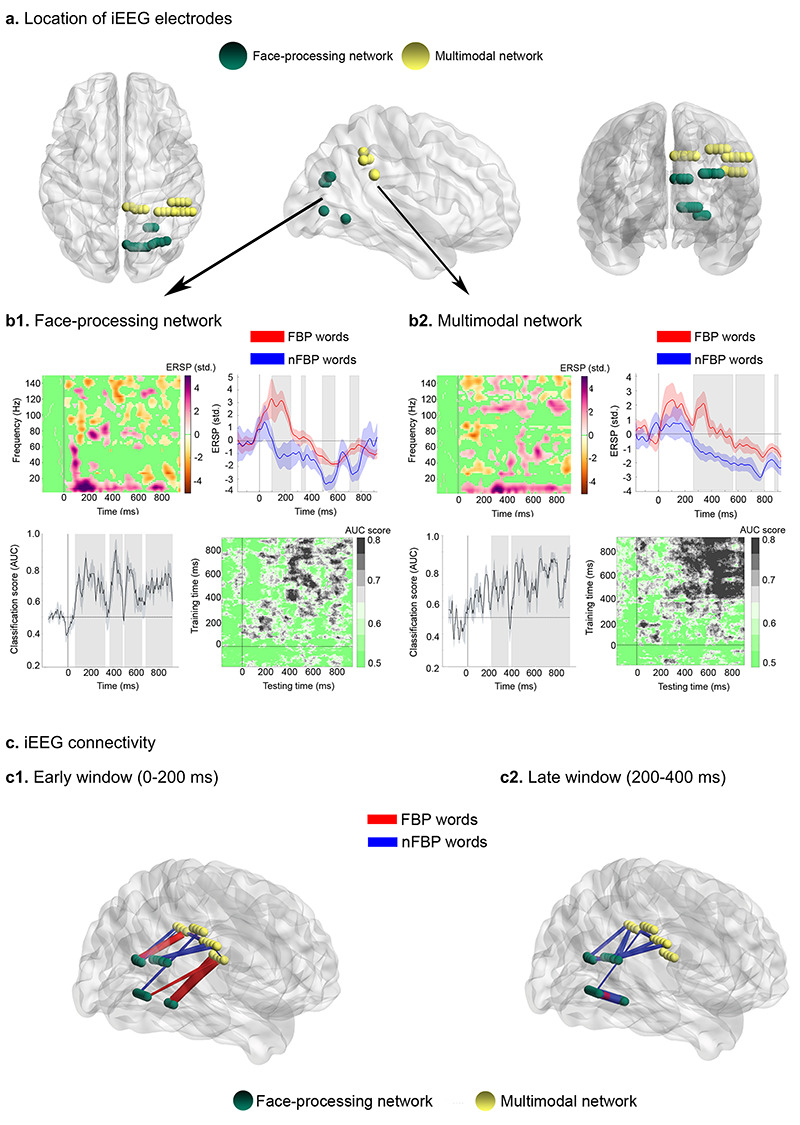
Figure 3.

Results from the iEEG case studies. (a) iEEG electrodes in MNI coordinate space. The face-processing network comprised key fusiform-face-area hubs (right fusiform, ventral/rostral lingual, and calcarine gyri); the multimodal network included electrodes within the angular and supramarginal gyri. (b1,b2) Upper left: Subtraction between the time-frequency charts of FBP and nFBP words from the face-processing (b1) and multimodal (b2) networks. Nonsignificant points were assigned zero values (P > 0.05, bootstrapping, FDR-corrected) relative to baseline and color-coded in green. Upper right: Word-type discrimination (based on 1–20 Hz activity) started at ~100 ms in the face-processing network (b1) and at ~250 ms in the multimodal network (b2). Lower left: Word-type classification (based on 1–20 Hz activity) was high (AUC scores ~80%, P < 0.05, Mann–Whitney U-test) across the first 200 ms in the face-processing network (b1) and consistently lower in the multimodal network (AUC scores ~70%, P < 0.05), peaking after 250 ms (b2). Shaded regions identify significant (above-chance) classification scores (P < 0.05). Lower right: Generalization-across-time matrices showing reactivated patterns of decodable information, peaking earlier for the face-processing network (b1) than the multimodal network (b2). Nonsignificant points were color-coded in green (P > 0.05). (c) Connectivity patterns discriminating between FBP and nFBP words based on the wSMI index, sensitized for the 1–20 Hz range (parameters: k = 3, τ = 32 ms). IEEG results revealed enhanced connectivity (P < 0.05, bootstrap, FDR-corrected) between both networks for FBP words in the early (0–200 ms) window (c1), progressing towards the opposite pattern in the late (200–400 ms) window (c2). Nodes indicate channel locations. Links reflect significant connections (P < 0.05, bootstrap, FDR-corrected) between nodes, with their thickness corresponding to t-values from between-condition comparisons.
