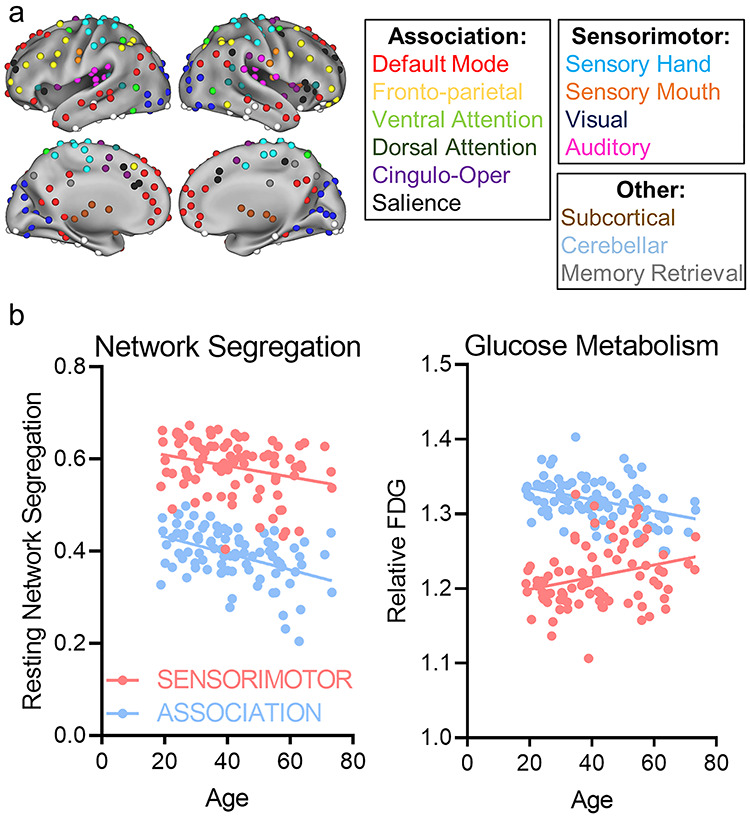
Figure 1.

(a) Regions from the Power et al. parcellation were aggregated into sensorimotor and association networks, as in the previous work. (b) Scatterplots depicting the associations between age and the resting network segregation (left) as well as glucose metabolism (right) across the study population (n = 88). There was a significant interaction with aging between glucose metabolism in association networks and glucose metabolism in sensorimotor networks (z = −4.51, P < 0.0001).
