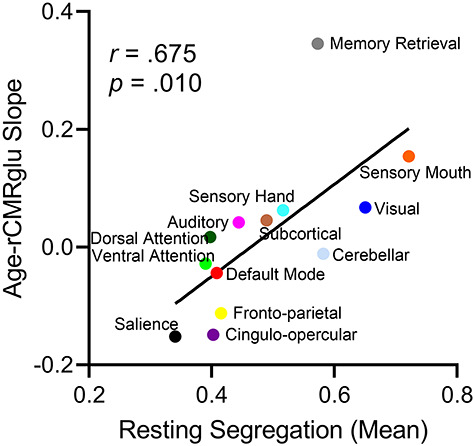
Figure 2.

The association between average resting segregation (x-axis) and the slope of age-related differences in relative glucose metabolism (rCMRglu) in that network (y-axis). The networks with the lowest segregation (or highest level of integration) tended to show a negative association between age and glucose metabolism.
