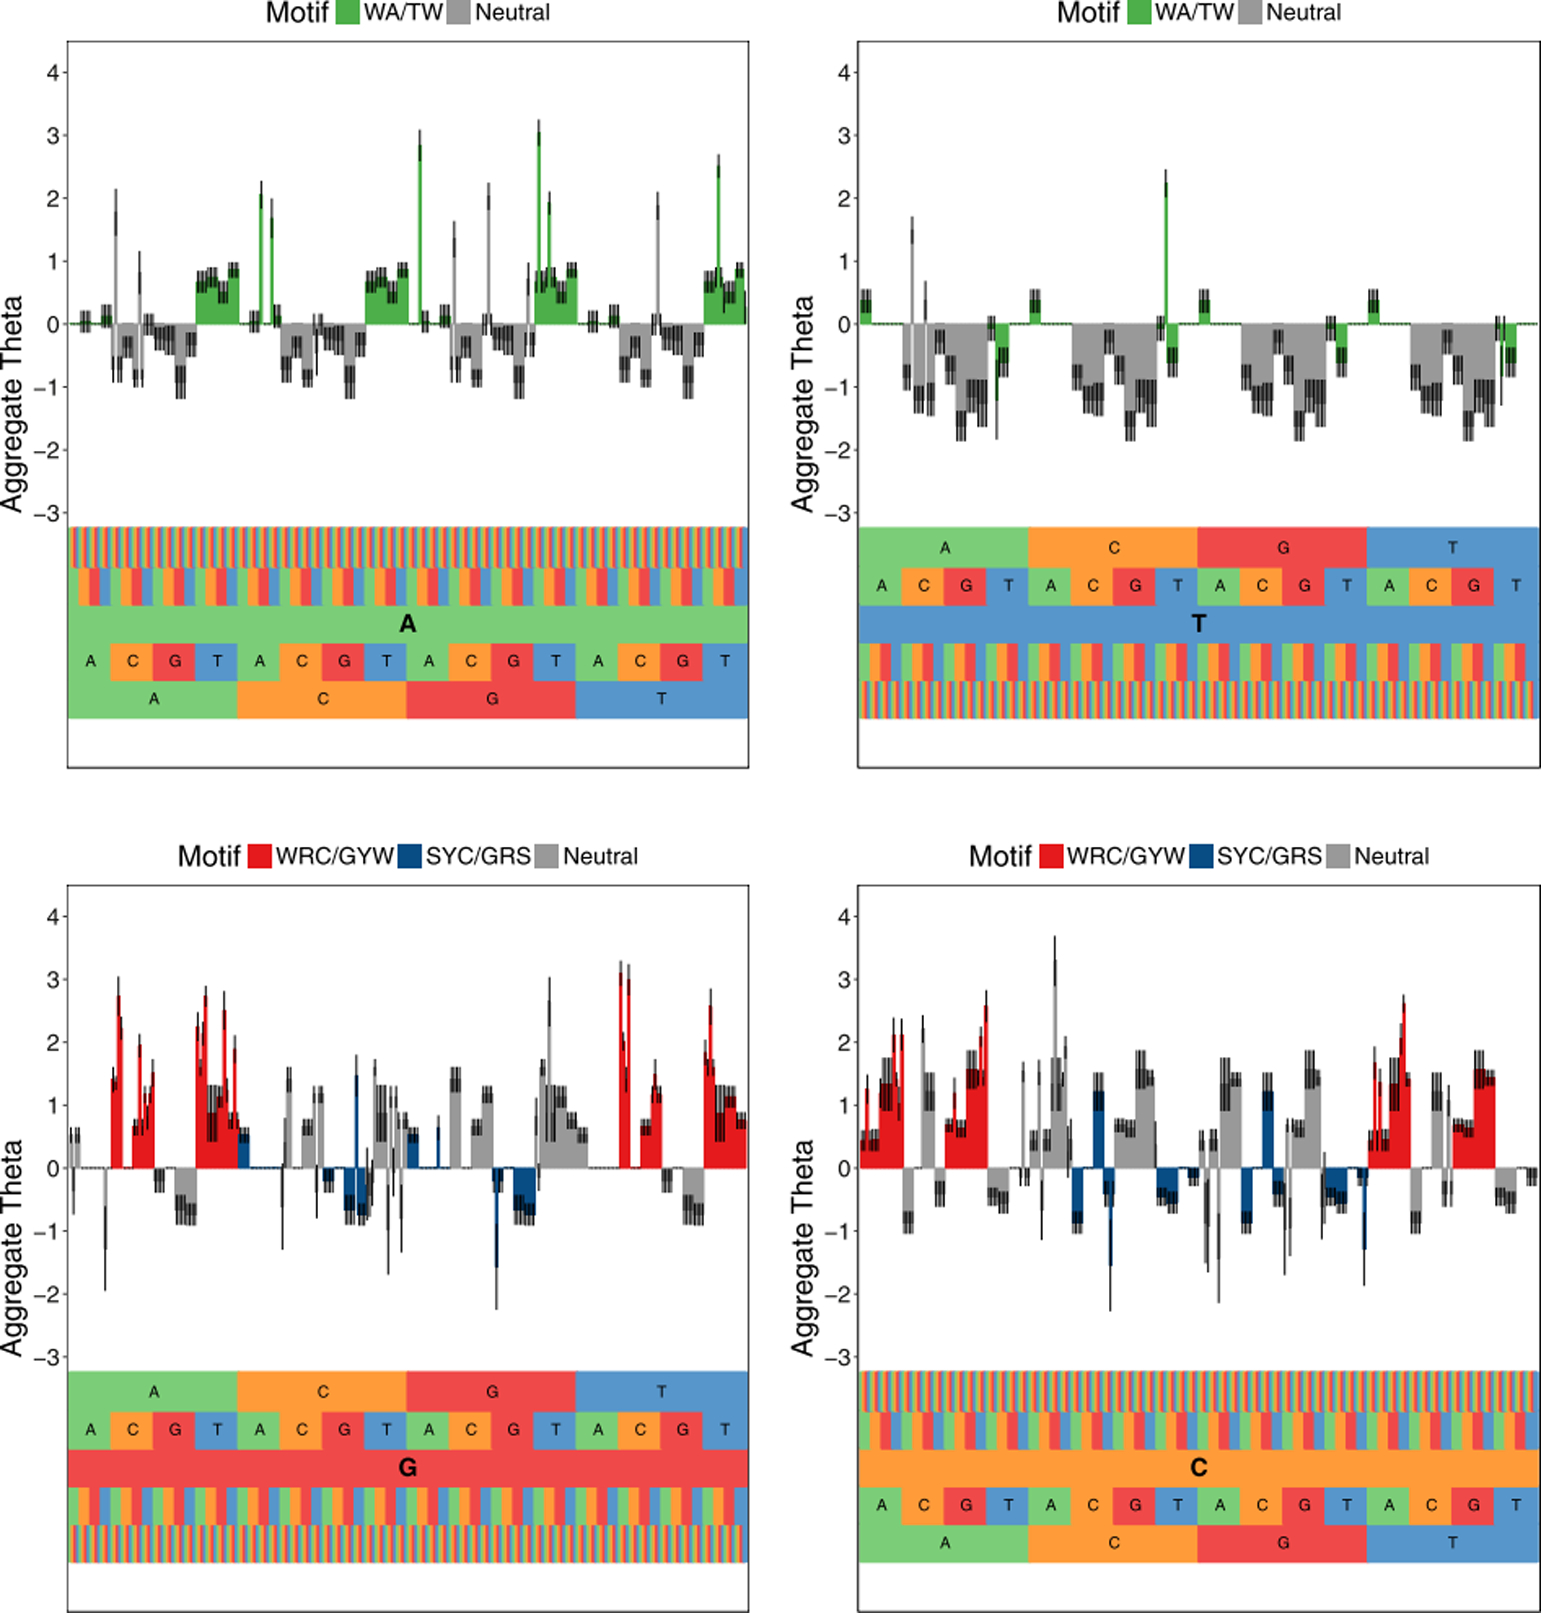
Fig 5.

Estimated somatic hypermutation model for mouse light chains using samm for 5-mer motifs centered on the bases A (top left), T (top right), G (bottom left), and C (bottom right). The motif corresponding to an x-axis position can be read from bottom to top. Plots depict the estimated aggregate θ of 5-mer motifs after estimating the model for a 3, 5-mer model and aggregating estimates using the procedure outlined in Section 2.5. A negative value means a reduced mutation rate relative to the baseline hazard, whereas a positive means an enhancement. Well-known hot spots, WRC/GYW and WA/TW, are colored red and green, respectively. The well-known cold spot SYC/GRS is colored blue. All other motifs are colored grey. The 95% uncertainty intervals for the estimates are depicted by black lines in the center of each bar.
