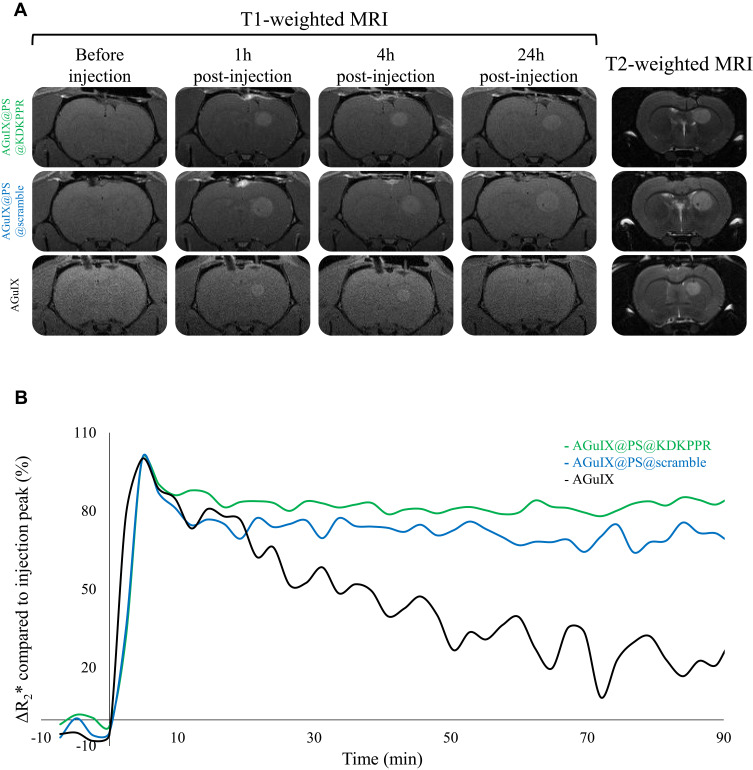
Figure 4.
Tumor tissue selectivity of nanoparticles using MRI analysis in xenografted nude rats. (A) Axial T2- and T1- weighted MRI before, 1, 4 and 24h after i.v. injection of AGuIX@PS@KDKPPR, AGuIX@PS@scramble or AGuIX nanoparticles (80 µmol.kg−1, Gd equivalent). Proton density weighted MRI (TR/TE: 5000/33 ms, NEX: 2, FOV: 4×4 cm, matrix: 256×256, slice thickness: 1 mm). (B) Monitoring of the ΔR2* relaxivity after injection of AGuIX@PS@KDKPPR (in green), AGuIX@PS@scramble (in blue) and original AGuIX nanoparticles (in black). The continuous T2*-weighted sequence over 90 minutes produced 45 images in coronal section. Each MRI images made it possible to establish the mapping of the ΔR2* relaxivity over time which was then normalized with the signal in the cerebellum (data points show the mean, n = 3).
Abbreviations: FOV, field of view; Gd, gadolinium; MRI, magnetic resonance imaging; NEX, number of excitations; TE, echo time; TR, repetition time; ΔR2*, measured relaxivity change.

