Figure 6.
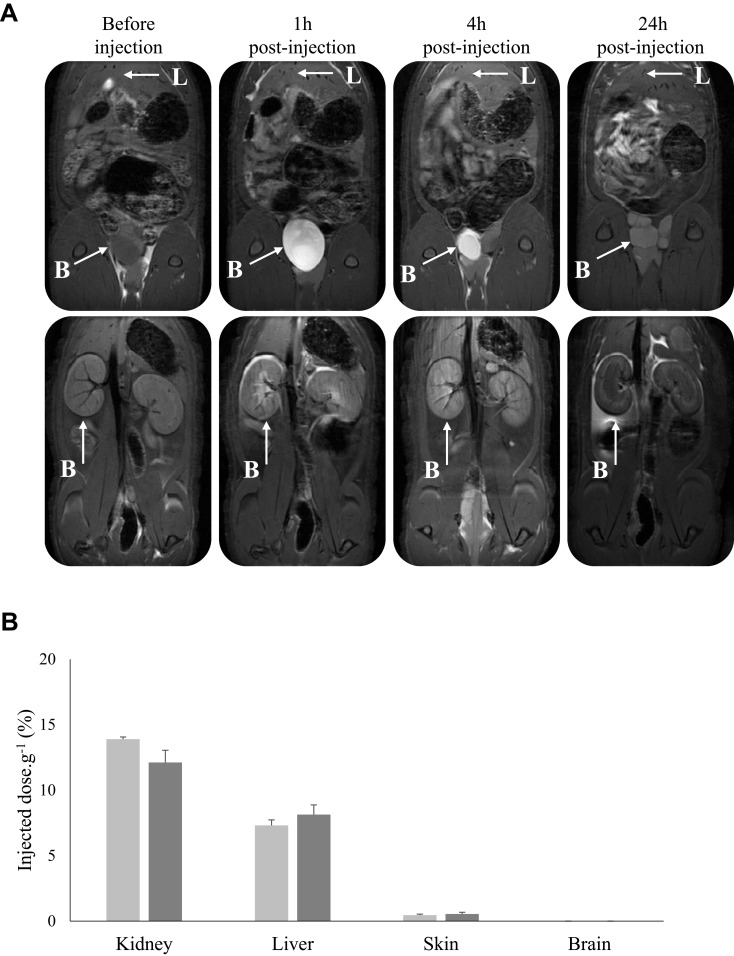
(A) Abdominal biodistribution visualized with dynamic T1-weighted image acquisition 1, 4 or 24 h after i.v. injection (80 µmol.kg-1, Gd equivalent for a body weight of 250 g) in the caudal vein of KDKPPR-conjugated nanoparticles. The parameters of the sequence were: TR/TE = 400/9 ms, 80 mm square FOV, matrix 256 × 256. 16 slices of 1.5 mm without interslice gap allowed detecting nanoparticles in kidneys and bladder. A positive MRI signal appeared in the renal cortex of kidneys and the bladder. (B) Gadolinium concentrations were evaluated in each organ by ICP-MS. The organs were collected 24h (light gray) and 72h (dark gray) after injection. Bars represent the average percent of the injected dose per gram of three different animals for each time point (data points show the mean ± SD, n = 3).
Abbreviations: FOV, field of view; Gd, gadolinium; ICP-MS, inductively coupled plasma mass spectroscopy; i.v., intravenous; MRI, magnetic resonance imaging; SD, standard deviation; TE, echo time; TR, repetition time.

