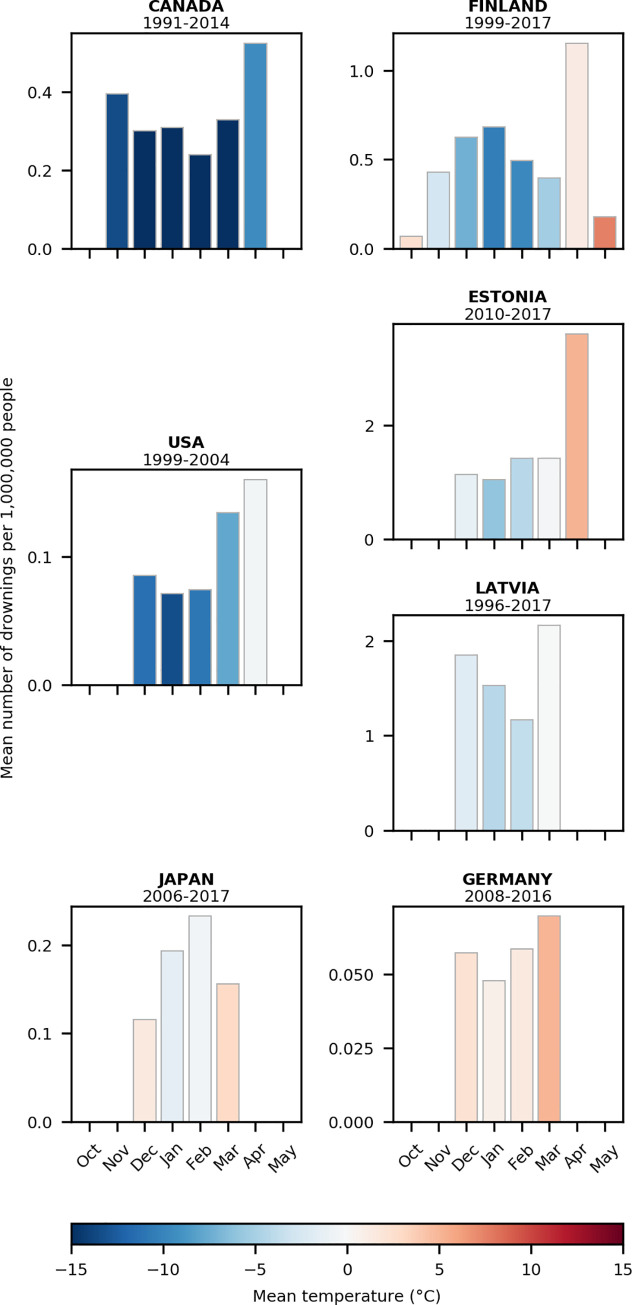
Fig 3. Winter drownings per capita by month.
Monthly winter drownings are presented on the right for European countries and on the left for North America and Asia. Monthly means are calculated for each country using the full extent of the time series of drowning data; bar plot colours reflect the mean monthly temperatures by month for each country. Years are indicated above each plot. Note: each graph is scaled differently and Japan refers specifically to the Nagano prefecture.

