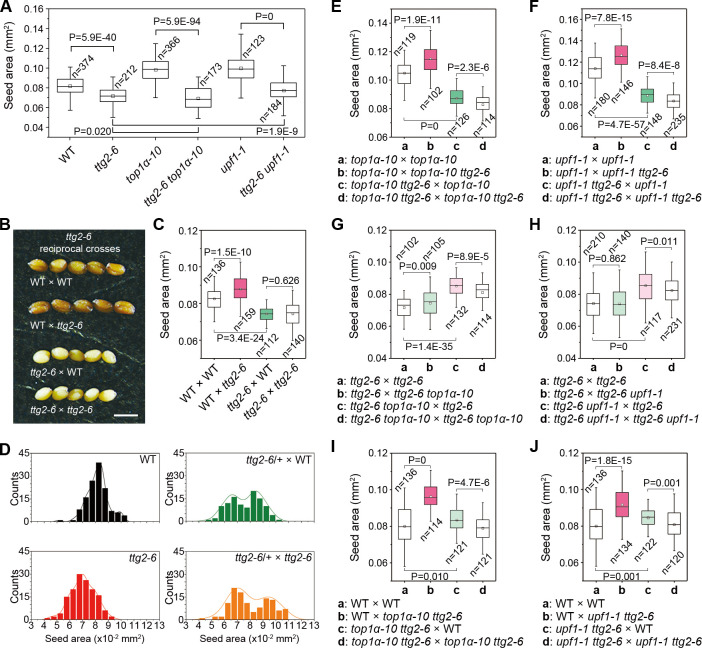
Fig 3. TTG2 acts downstream of TOP1α and UPF1.
(A) ttg2-6 is epistatic to top1α-10 and upf1-1 pertaining to seed size. (B) Representative seeds from reciprocal crosses between WT and ttg2-6. Scale bars, 0.5 mm. (C) Parent-of-origin effect of ttg2-6 pertaining to seed size. (D) Histograms of the size distributions of seeds produced by ttg2-6-related testcrosses. The distribution curves were determined by kernel-density estimation. (E, F) Parent-of-origin effect of ttg2-6 in top1α-10 (E) and upf1-1 backgrounds (F). (G, H) Parent-of-origin effect of top1α-10 (G) and upf1-1 (H) in ttg2-6 background. (I, J) Parent-of-origin effect of ttg2-6 top1α-10 (I) and ttg2-6 upf1-1 (J) pertaining to seed size. (A, C, and E-J) P values were determined by two-tailed Mann-Whitney U-test. The data underlying this figure are included in S1 Data. n, number of seeds examined; WT, wild-type plants.

