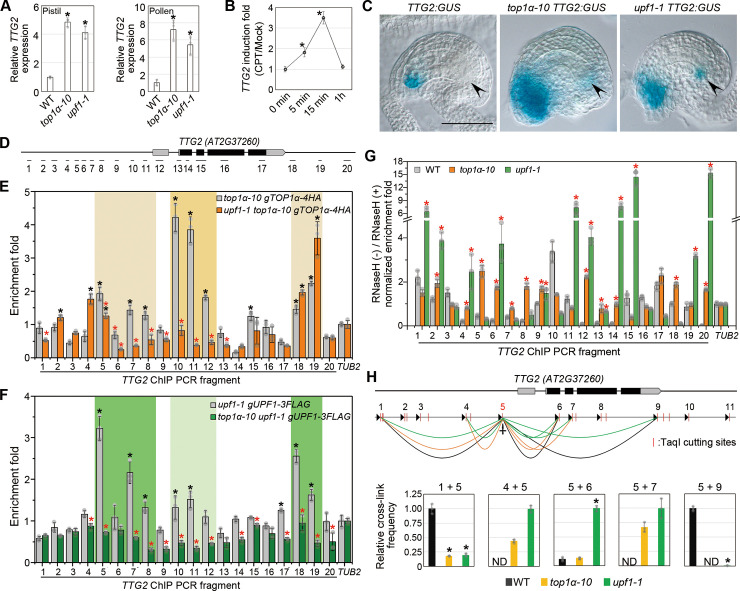
Fig 4. TOP1α and UPF1 directly repress TTG2.
(A) TTG2 expression in pistils (left panel) or pollens (right panel) in different genetic backgrounds. Expression values normalized against U-BOX are shown relative to the expression level in WT. Values are mean ± s.d. of three biological replicates. *P < 0.05 as compared to WT, two-tailed Student’s t test. (B) CPT treatment induces TTG2 expression. Time-course experiments were conducted by treating the pistils with 10 μM CPT or mock solution. Fold change of CPT-treated versus mock-treated at each time point is presented as mean ± s.d. of three biological replicates. *P < 0.05 as compared to “0 min,” two-tailed Student’s t test. (C) Representative GUS staining of TTG2:GUS in WT (left), top1α-10 (middle), and upf1-1 (right) backgrounds. Scale bar, 50 μm. Arrowheads indicate antipodal cells. (D) Schematic diagram of the fragments amplified in ChIP and DRIP analysis spanning the TTG2 genomic region. The coding and untranslated regions are indicated by black and gray boxes, respectively, and introns and other genomic regions are indicated by black lines. (E, F) ChIP analysis of TOP1α-4HA (E) and UPF1-3FLAG (F) binding to the TTG2 genomic region. Pistil samples were harvested for ChIP analysis using anti-HA (E) or anti-FLAG (F). Values are mean ± s.d. of three biological replicates. The black asterisks indicate significant enrichment compared to that of TUB2. The red asterisks indicate significantly decreased enrichment when UPF1 is absent (E) or TOPα is absent (F). *P < 0.05, two-tailed Student’s t test. (G) DRIP analysis at TTG2 genomic region. Pistil samples were harvested for DRIP analysis using S9.6 antibody. Values are mean ± s.d. of three biological replicates. The red asterisks indicate significantly higher enrichment in comparison with WT. *P < 0.05, two-tailed Student’s t test. (H) 3C analysis of chromatin looping at the TTG2 locus. Upper panel: Schematic diagram of the spatial interactions at TTG2 genomic locus. Detectable spatial interactions are linked by black (in WT), orange (in top1α-10), and green arcs (in upf1-1) between the anchor point (site 5) and surrounding loci. Arrowheads indicate the primers for qPCR. Lower panel: the cross-link frequencies are shown relative to the strongest interaction at each site. Values are mean ± s.d. of three biological replicates. *P < 0.05 as compared to WT, two-tailed Student’s t test. The data underlying this figure are included in S1 Data. 3C, chromatin conformation capture; ChIP, chromatin immunoprecipitation; CPT, camptothecin; DRIP, DNA:RNA hybrid immunoprecipitation; GUS, β-glucuronidase; HA, hemagglutinin; ND, not detectable; qPCR, quantitative PCR; WT, wild-type plants.

