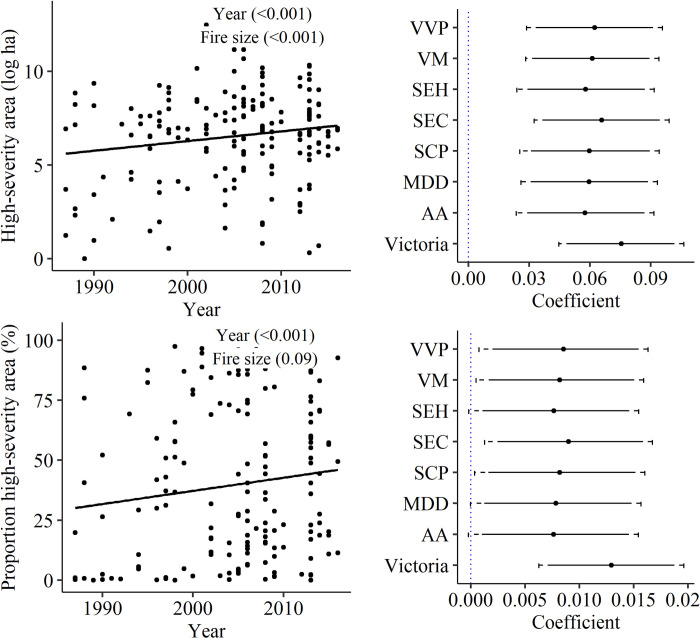
Fig 3. Changes in the area and proportional area of high-severity fire from 1987 to 2017.
Left panels: Area and proportional area burnt by high-severity fire in each of 162 wildfires (line represents significant relationship between variables). Right panels: Standardized coefficients for high-severity area (top, log transformed) and the proportion high-severity area (bottom, arcsine transformed) indicating the relationship between area burnt and time. Each panel displays results for a single model for all regions (“Victoria”) and for individual bioregions (Acronyms of bioregions are defined in Table 1); Dot points represent mean estimated coefficient along with the 90th (solid line) and 95th (dashed line) percentile intervals. Coefficients denote significant changes when interval does not include zero.

