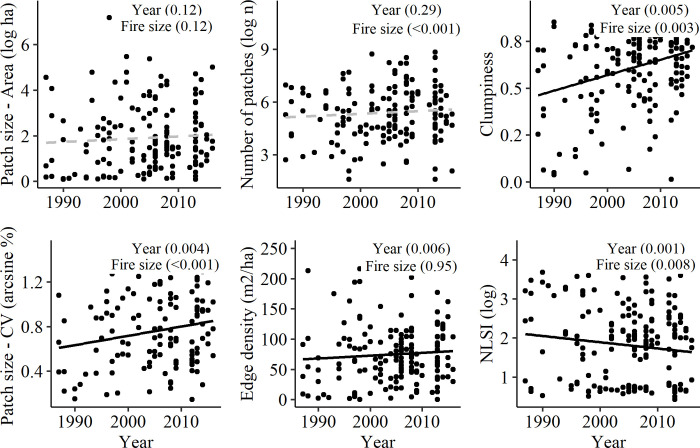
Fig 4. Changes in high-severity spatial metrics over time.
Each subplot displays a scatterplot between the Year of the fire and the defined high-severity spatial metric. Dots represent each of the 162 wildfires. Values are the results for single mixed effects models where Year and Fire size are fixed effects and Bioregion is a random effect. Lines represent significant (solid black) or not significant (dashed grey) linear relationships.

