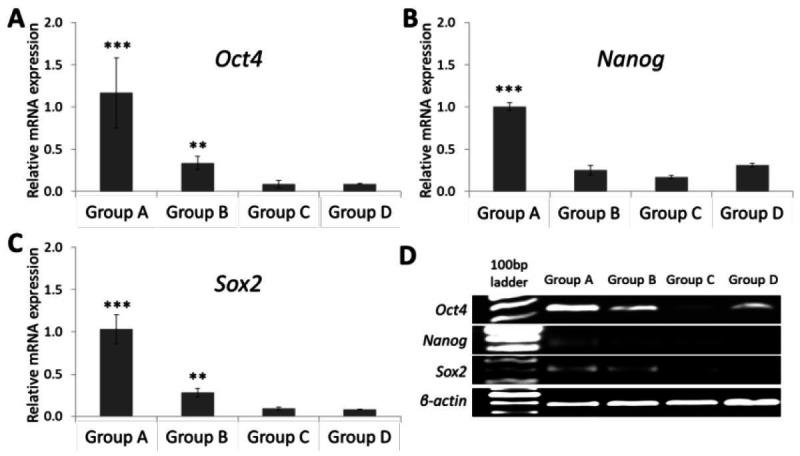
Figure 1. Quantitative Reverse transcriptase polymerase chain reaction analysis shows the expressions of stemness markers: (A), (B), (C) mRNA expression levels of Oct4, Nanog, and Sox2 (D) agarose gel electrophoresis and Gelred staining after qRT-PCR. ***P < 0.001 (group A) vs. other groups, **P < 0.01 (group B) vs. group C and group D.

