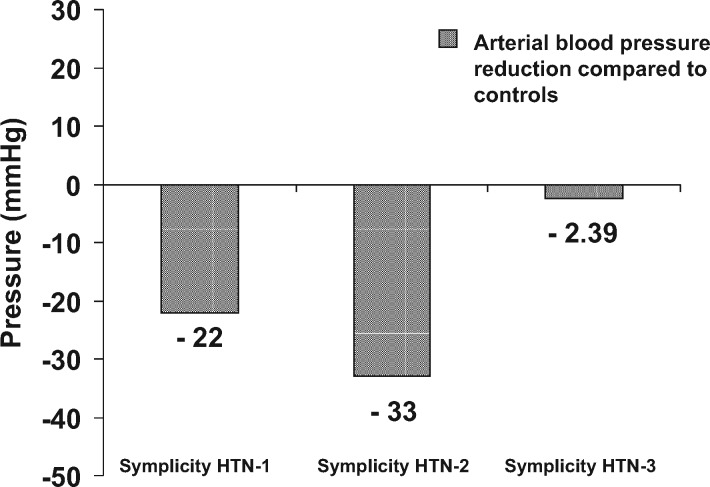
Figure 3.
The comparison of the six-month blood pressure data of HTN-3 with those of the HTN-1 and HTN-2 studies is truly surprising. The evident effect of renal denervation on blood pressure values obtained in the HTN1 and HTN-2 studies could be linked to the phenomenon of ‘regression from the average’: typical bias of registers and observational studies, with very high standard deviation. Having ‘overestimated’ the effectiveness of the procedure in previous studies may have led to an error in the calculation of the sample size (calculation of power) of patients to be recruited in HTN-3.

