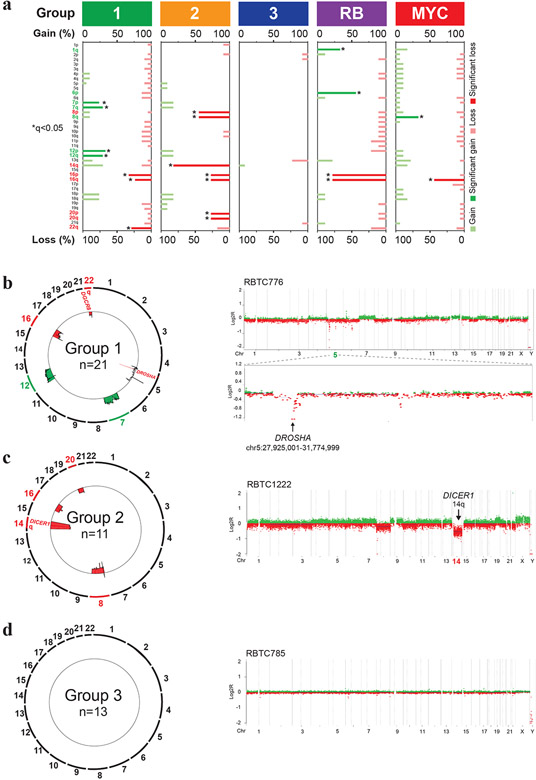
Figure 2. PB molecular subgroups have distinct copy number landscapes.
a. Pattern of copy number alterations across PB molecular sub-groups as determined using GISTIC analyses of global methylation data. Chromosomal regions with recurrent copy number gains (green) or losses (red) significantly enriched within each PB sub-group are highlighted; asterisk indicates false discovery rate of q<0.05.
b, c. Composite circos plots of global methylation profiles showing recurrent copy number gains (green) and losses (red) in 21 group 1 and 11 group 2 PBs. Focal or broad alterations associated with miRNA biogenesis loci DICER1, DROSHA and DGRC8 are highlighted. Higher resolution copy number profiles generated using Conumee, of representative group 1 and group 2 samples with respective focal chr 5p13.3 targeting DROSHA and chr 14q loss associated with DICER1, are shown on the right.
d. Composite circos plot of global methylation profiles in 13 group 3 PBs. Higher resolution copy number profile generated using Conumee of a representative group 3 sample is shown on right.

