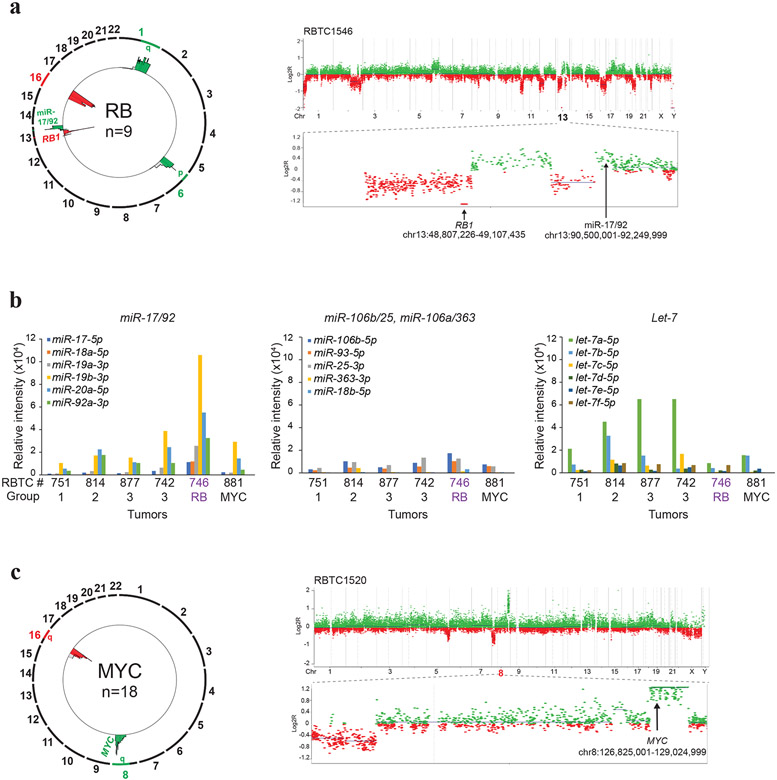
Figure 3. Recurrent copy number alterations in RB and MYC sub-group PBs.
a. Composite circos plot of global methylation profiles from 9 RB subgroup PBs depicting recurrent copy number gains (green) and losses (red); recurrent copy number alterations associated with miR-17/92 and RB1 are highlighted. Higher resolution copy number profile of a representative tumor RBTC 1546 with homozygous loss of RB1 at chr13q14.2 and copy number gain encompassing miR-17/92 at chr 13q31.3 is shown on right.
b. Copy number driven expression of miR-17/92 in RB sub-group PB. MiRNA expression levels for the miR-17-92, paralogous miR106a-363, miR-106b-25 and unrelated let-7 loci was determined from NanoString(v.3) miRNA expression data from 6 PBs. Plots show relative, normalized probe intensities of miRNAs in PB sub-groups; miRNA expression levels of RBTC746 with focal chr13q13.3 copy number gains targeting miR-17-92 shown in Figure A, is highlighted.
c. Composite circos plot of global methylation profiles from 18 MYC subgroup PBs. Recurrent focal chr 8q amplification/gains (green) and chr 16q losses (red) are highlighted. Higher resolution copy number profile of a representative tumor, RBTC 1520, with focal MYC amplification is shown on right.

