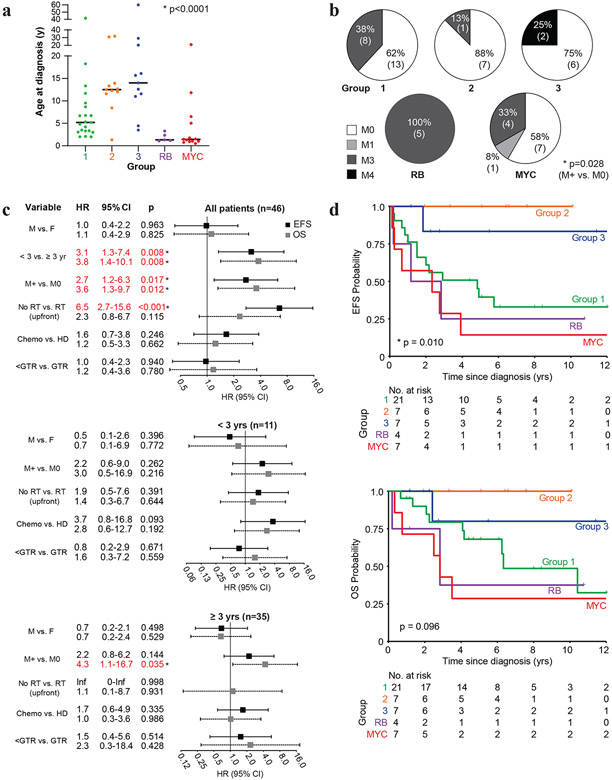
Figure 5. Molecular sub-groups of PB have distinct clinicopathologic features.
a. Scatterplot of age at diagnosis for PB patients relative to tumor molecular sub-group. Bar indicates median age as determined using Kruskal-Wallis test.
b. Frequency of metastatic (M+; M1, −3, −4) and non-metastatic (M0) disease determined as per the Chang staging system is shown relative to PB sub-groups; significance in distribution of M+ versus M0 patients across all PB sub-groups was determined using Fisher exact test.
c. Forest plot of Hazard ratio (HR) from univariate Cox proportional hazards regression model of gender (male/M vs. female/F), age, metastatic status (M+ vs M0), radiotherapy (no upfront RT vs. upfront RT), conventional chemotherapy only (chemo) vs. high-dose chemotherapy (HD), and extent of tumor removal (less than gross total resection/GTR vs GTR) on EFS (black) and OS (gray) was performed on data from 46 patients treated with curative intent. Whiskers denote 95% confidence interval.
d. Kaplan-Meier survival analyses of event free (EFS) and overall survival (OS) for 46 patients treated with curative intent stratified by PB sub-groups. Plots abbreviated to maximum of 12 years from diagnosis. For patients with group 1-3, RB, and MYC PBs EFS were respectively, 39.5%, 100%, 83.3%, 25.0%, and 14.3%; 5-year OS were 68.0%, 100%, 80%, 37.5%, and 28.6%.

