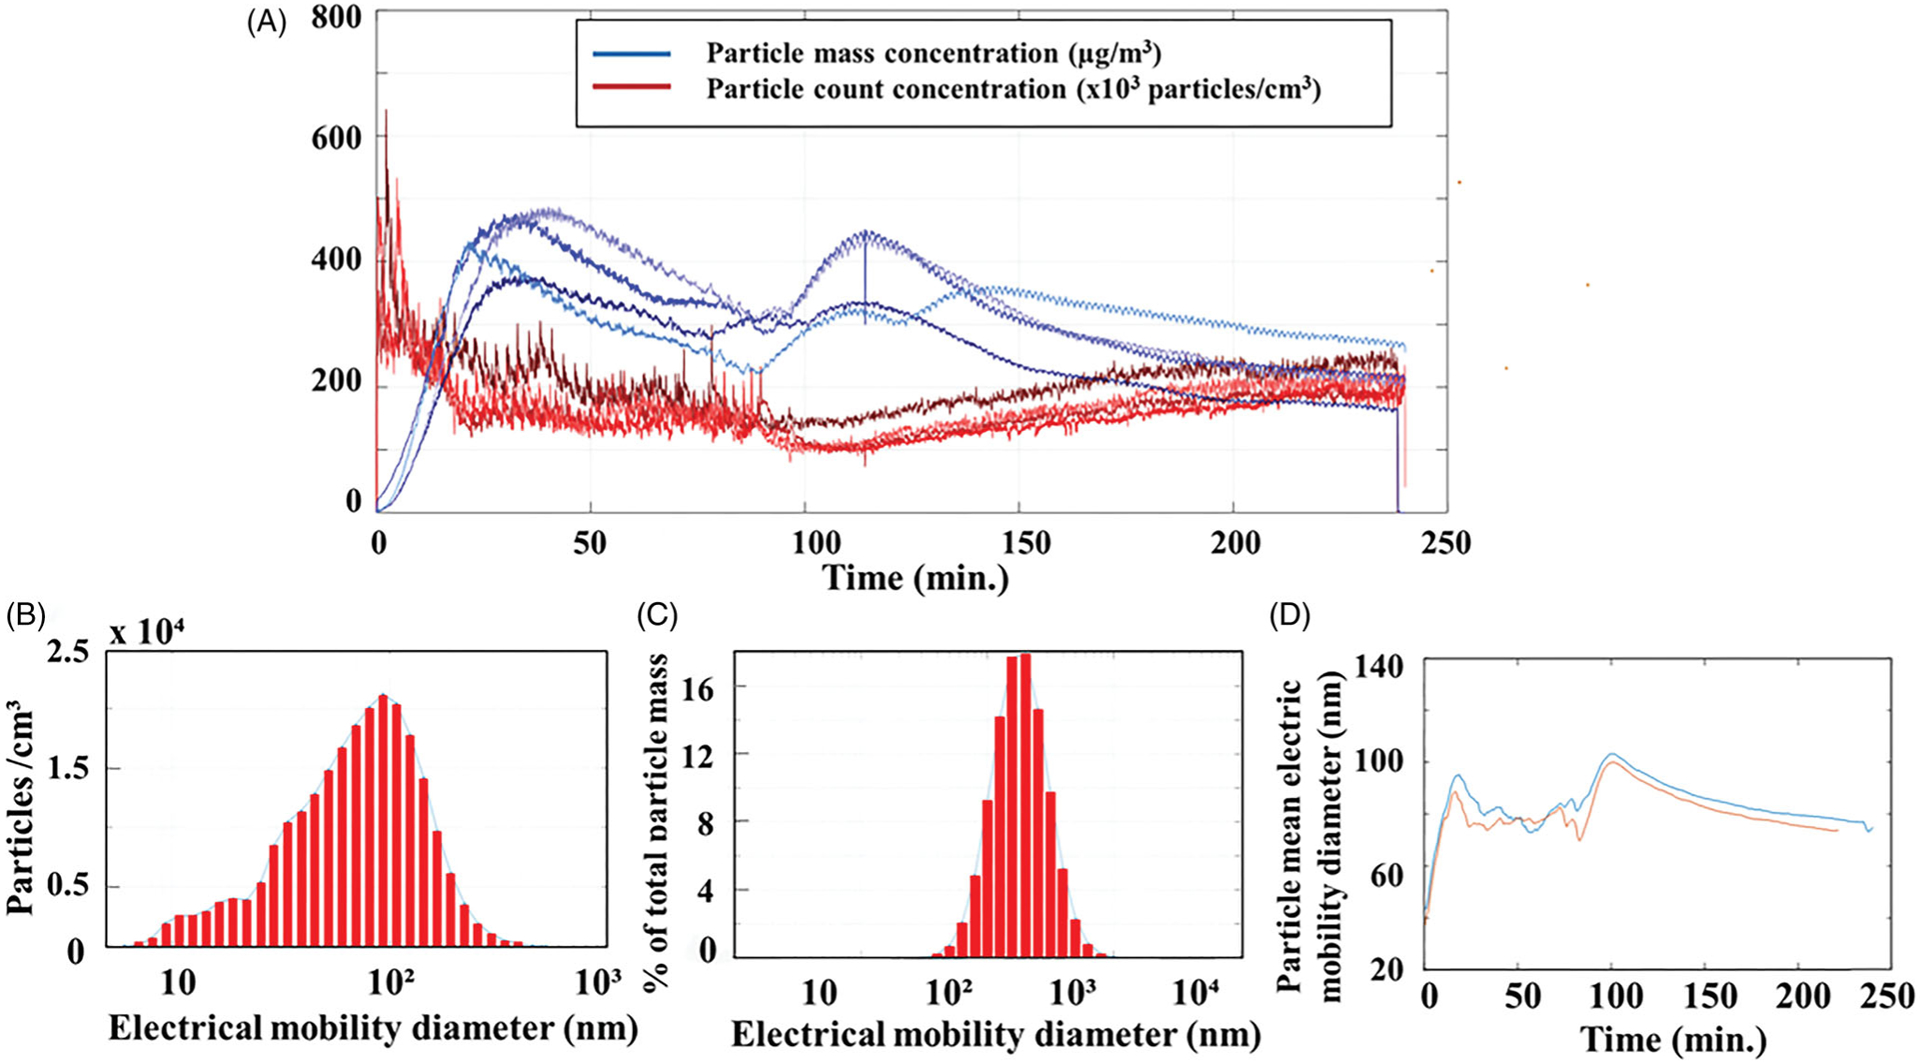
Figure 2.

Chamber particle characterization. (A) Particle mass concentrations (red lines), and particle counts (blue lines) over time; (B) particle size distribution plot count-based; (C) particle size distribution from count-based converted to mass by assuming all particles were spherical and had a density of 1 g/cm3; (D) particle geometric mean electric mobility diameter during two 4-h print jobs.
