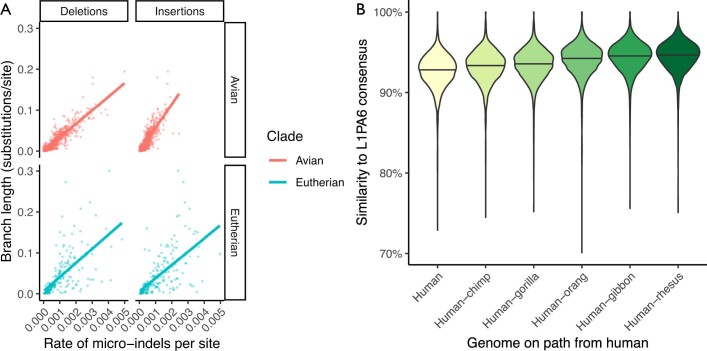
Extended Data Fig. 3. Analysing insertions, deletions and L1PA6 repeats in the 600-way alignment.
a, Rates of micro-insertions and -deletions (micro-indels) along each branch within the 600-way alignment, compared to conventional substitutions/site branch length. The data from avian and eutherian branches are separated. Lines show a best-fit linear model for each category. b, Violin plot showing the increasing similarity to consensus of L1PA6 elements within reconstructed ancestral genomes along the path to the emergence of modern L1PA6 elements (in the human-rhesus ancestor). Horizontal lines indicate the median values.

