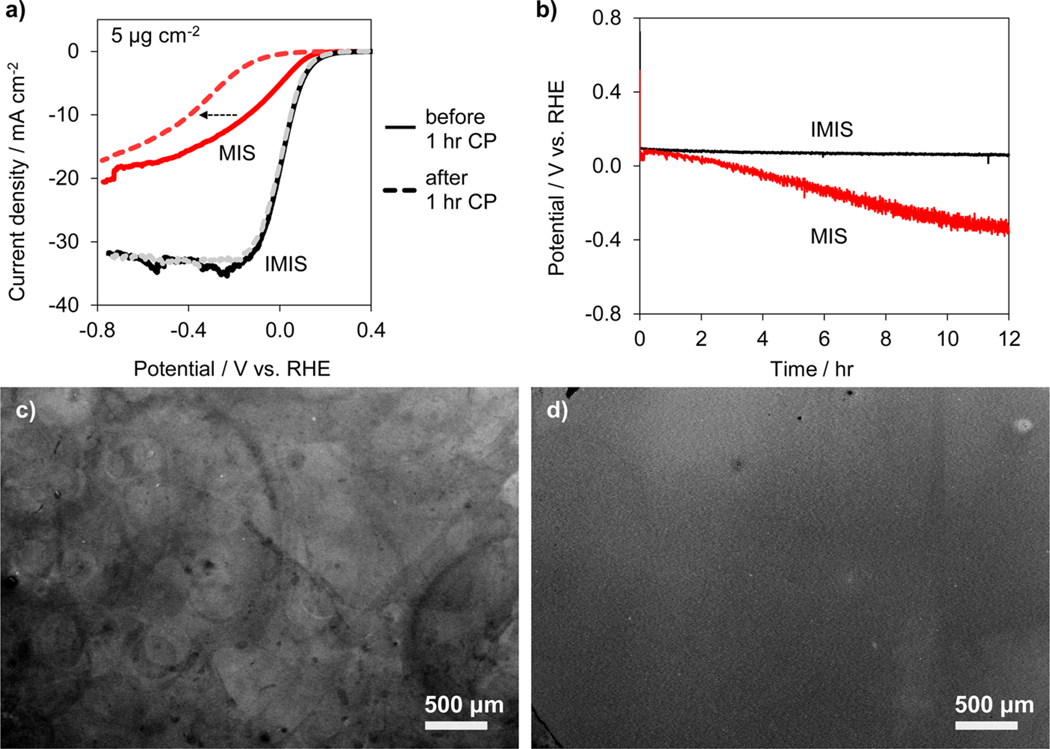
Figure 3.
MIS and IMIS stability. (a) LSV measurements for MIS (red) and IMIS (black) samples with 5 μg cm−2 Pt loading before (solid lines) and after (dashed lines) the 1 h CP stability test conducted at −10 mA cm−2 for 1 h. The IMIS sample was fabricated with a 10 nm thick SiOx overlayer, and the LSV sweep rate was 20 mV s−1. (b) CP stability measurements for MIS (gray curve) and IMIS (black curve) samples with 12 μg cm−2 Pt loading operating at −10 mA cm−2 for 12 h. Measurements performed in 0.5 mol L–1 H2SO4 under simulated AM 1.5 G illumination. Low resolution SEM images of (c) MIS and (d) IMIS samples after the 12 h CP stability test.

