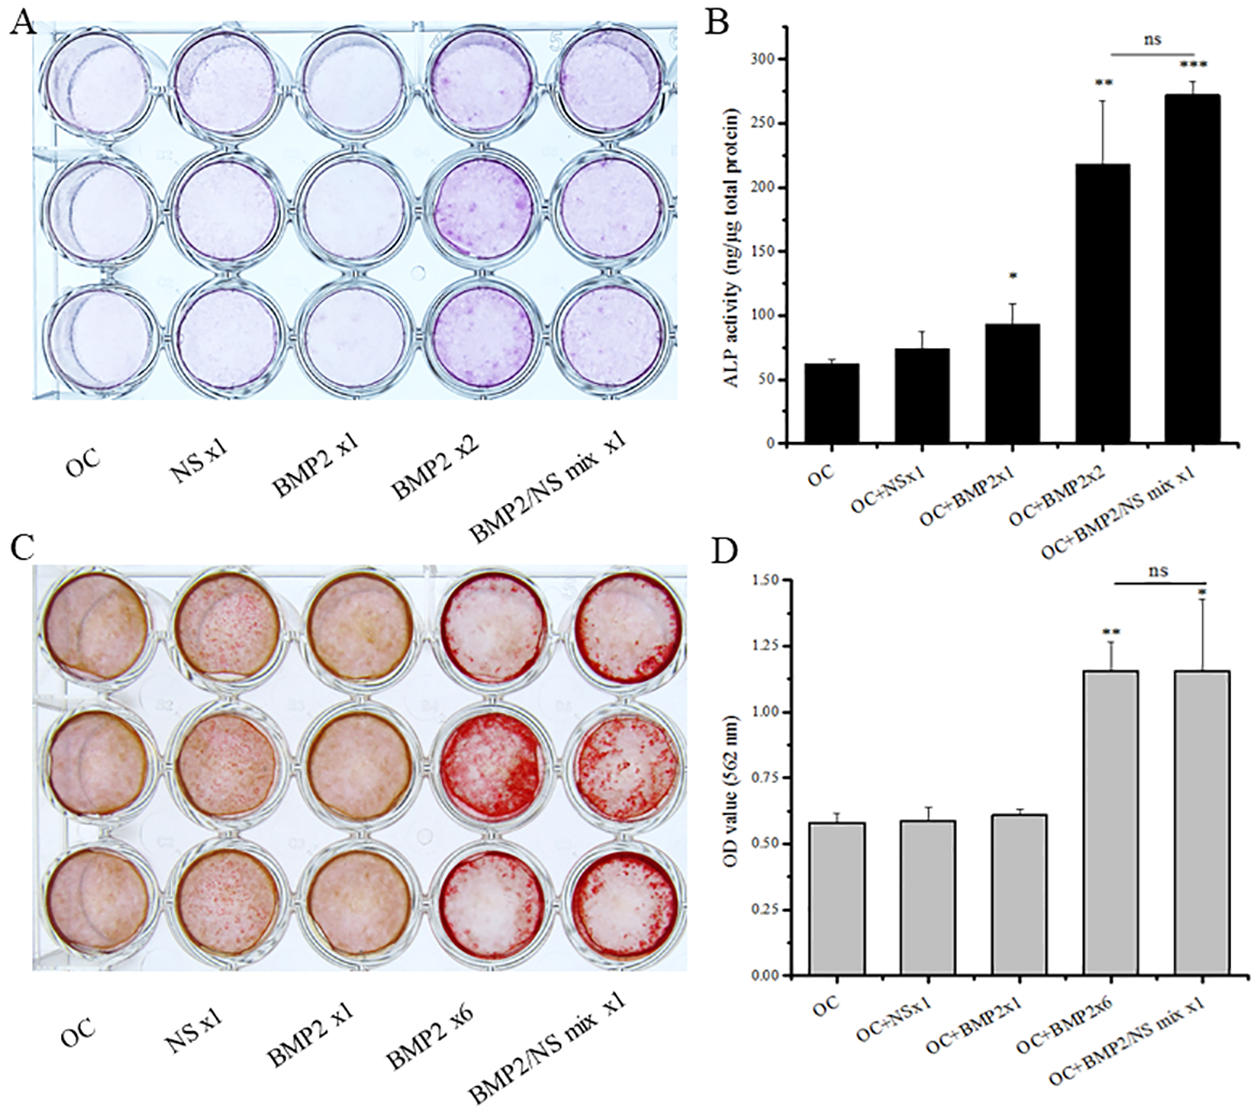
Fig. 2.

Effects of NS on MC3T3-E1 cells osteogenic differentiation. (A) ALP staining, (B) ALP quantification, (C) Alizarin Red S staining and (D) CPC quantification of MC3T3-E1 cells after treatment with different inductive factors in osteoconductive (OC) medium. Data are expressed as mean ±SD, n = 3. (*P < 0.05, **P < 0.01, ***P < 0.001 vs. OC control)
