
Fig. 1. National maps of historical PM2.5 concentrations and COVID-19 deaths.
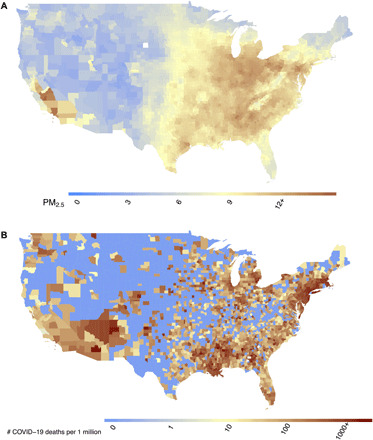
Maps show (A) county-level 17-year long-term average of PM2.5 concentrations (2000–2016) in the United States in μg/m3 and (B) county-level number of COVID-19 deaths per 1 million population in the United States up to and including 18 June 2020.