
Fig. 2. Second-order meta-analysis shows how agriculture diversification promotes biodiversity and ecosystem services without compromising crop yield when compared with cropping systems without these practices.
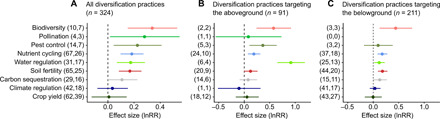
(A) All diversification practices included (324 effect sizes and 69 meta-analyses, based on 5160 original studies with 41,946 comparisons). (B) Diversification practices targeting the aboveground environment (crop and noncrop diversity; 91 effect sizes and 24 meta-analyses). (C) Diversification practices targeting the belowground environment (organic amendment, reduced tillage, and inoculation; 211 effect sizes and 55 meta-analyses). Note the difference in scale of the x axes when comparing (A) with (B) and (C). Organic farming is included only in the global model (A) since it often includes practices targeting both above- and belowground environments. The number of effect sizes and meta-analyses included in each category are displayed in parentheses. Ecosystem service categories are classified following (13, 14, 27) (table S2). Error bars represent 95% CIs.