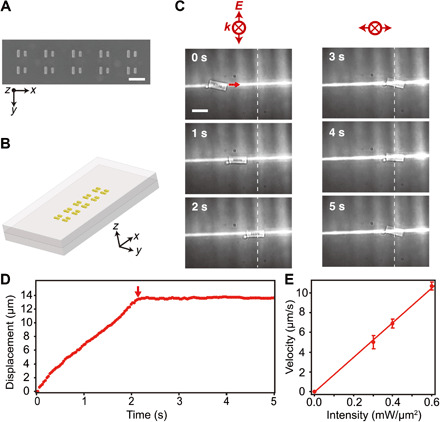
Fig. 2. Direct observation of linear nanomotors.

(A) SEM image of the nanomotors, a linear array (Λx = 660 nm and Λy = 400 nm) of 10 asymmetric nanorod pairs in Fig. 1A. Scale bar, 400 nm. (B) The sample is a 600-nm-thick, 6 μm by 2.5 μm rectangular silica block containing the nanomotors in its center. (C) Time sequence of optical microscopy images showing the movement of the sample, provided by the nanomotors, in water under the normal incidence of a linearly polarized light beam (wavelength of 910 nm and intensity of 0.4 mW/μm2). The optical focal line generated using a cylindrical lens aligns the sample along its line axis, enabling control of the incident polarization direction for the nanomotors. Scale bar, 5 μm. (D) Translational dynamics of the sample in (C). When the sample arrives at the position, shown by white dashed lines in (C) and a red arrow in (D), the polarization is changed from parallel to perpendicular to the rod axis, while keeping the light intensity constant (see also movie S2). (E) Dependence of the measured velocity of the lateral motion on the light intensity. The straight line is linear to fit the data.
