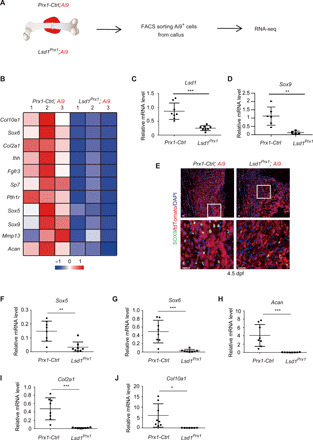
Fig. 2. LSD1-deficient Prx1 lineage cells show decreased SOX9 expression during fracture healing.

(A) Illustration of fluorescence-activated cell sorting (FACS) sorting of Prx1 lineage cells from Lsd1Prx1 and control mice fractured femurs at 4.5 dpf. (B) Heat map showed the differentially expressed chondrocyte-related genes in the RNA-seq samples from fractured femurs of Lsd1Prx1 and control mice. (C and D) RT-PCR analysis of the expression levels of candidate genes in Prx1-lineage callus cells sorted from fractured femur of Lsd1Prx1 and control mice at 4.5 dpf. Data are presented as means ± SD (n = 8). Unpaired t test, **P < 0.01 and ***P < 0.001. (E) Immunofluorescence staining showed the expression of SOX9 at fracture site in Lsd1Prx1 and control mice at 4.5 dpf. n = 2 per genotype. Scale bars, 25 μm. (F to J) RT-PCR analysis of the expression levels of genes in Prx1 lineage callus cells sorted from fractured femurs of Lsd1Prx1 and control mice at 4.5 dpf. Data are presented as means ± SD (n = 8). Unpaired t test, *P < 0.05, **P < 0.01, and ***P < 0.001.
