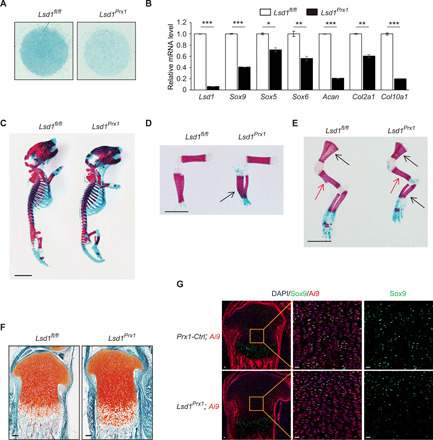
Fig. 3. LSD1 regulates the expression of SOX9.

(A) Alcian blue staining of micromass culture using periosteal cells isolated from Lsd1Prx1 and control mice. n = 4. (B) Relative mRNA expression of chondrocyte marker genes at day 6 were analyzed by RT-PCR, n = 3. Unpaired t test, *P < 0.05, **P < 0.01, and ***P < 0.001. (C to E) Skeletal preparations of newborn mice at postnatal day 2 were shown for whole skeletal (C) and limbs (D and E). Scale bars, 25 mm. (F) Growth plate sections of the tibia of Prx1-CKO and control mice (n = 3) at postnatal day 2 as shown by Safranin O staining. Scale bars, 20 μm. (G) Immunofluorescence staining showed the SOX9 protein level in the growth plate from P2 Lsd1Prx1 and control mice. n = 3. Scale bars, 20 μm.
