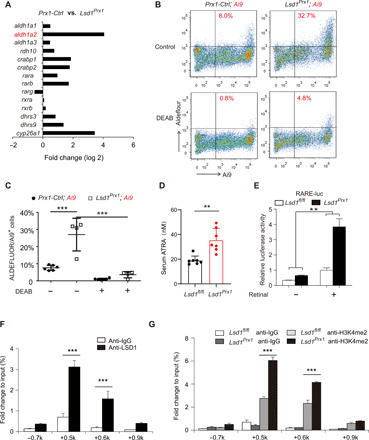
Fig. 4. LSD1 inhibits RA signaling through suppression of ALDH1A2.

(A) Quantitative expression analysis of RA signaling–related genes in the RNA-seq samples from fractured femurs of Lsd1Prx1 and control mice. (B and C) Flow cytometric analysis of ALDH activity of Prx1 lineage cells in the presence and absence of the ALDH inhibitor DEAB to show specificity. n = 4 to 6 mice per group; data represent means ± SD. ANOVA followed by Tukey’s post hoc test was performed, ***P < 0.001. (D) Concentrations of endogenous ATRA in serum of Lsd1Prx1 and Prx1-Ctrl mice by LC-MS/MS analysis. Unpaired t test was performed, n = 7 mice per group, **P < 0.01. (E) Luciferase assay detected RA signaling in Lsd1Prx1 and control periosteal cells treated with all-trans retinal for 12 hours. Results are representative of two independent experiments. Data are represented means ± SD. Unpaired t test was performed, **P < 0.01. (F) ChIP-qPCR analysis of LSD1 enrichment in the Aldh1a2 promoter regions in periosteal cells. n = 3 for each group, data are represented means ± SD. Unpaired t test was performed, ***P < 0.001. IgG, immunoglobulin G. (G) ChIP-qPCR analysis of H3K4me2 enrichment in the Aldh1a2 promoter regions in periosteal cells derived from 4-week-old Lsd1Prx1 and Lsd1fl/fl mice. n = 3 for each group; all data represent means ± SD. ANOVA followed by Tukey’s post hoc test was performed, ***P < 0.001.
