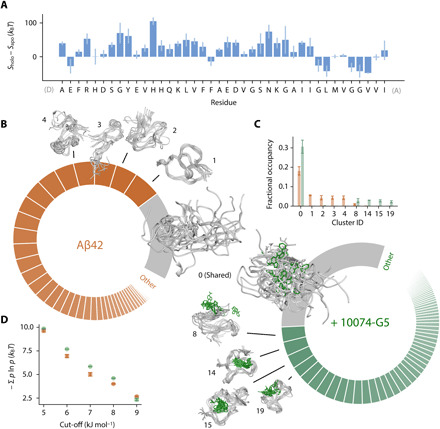
Fig. 3. 10074-G5 increases the conformational entropy of Aβ42.

(A) Residue-specific differences in the conformational entropies, S, between the holo and apo ensembles, estimated from normalized, two-dimensional (2D) Ramachandran histograms (100 × 100 bins) of each residue using S = − Σ b ln b where b is the occupancy of a given bin. (B) Donut plots quantifying the conformational states of Aβ42 in the unbound (left, orange) and bound (right, green) simulations. Clustering was performed on concatenated trajectories, considering only Aβ42. Inter-residue contact maps based on the Lennard-Jones potential were used as input for GROMOS clustering (34). The cut-off value is 8.5 kJ mol−1. Each slice represents a distinct state. The simulations share one major state (cluster 0, gray), which comprises 18 and 31% of the unbound and bound ensembles, respectively. (C) Convergence of the five most populated clusters. Bar plot shows fractional cluster occupancies for the unbound (orange) and bound (green) simulations. Fractional cluster occupancies were calculated on 35,000 frames for each concatenated trajectory sampled based on metadynamics weights. (D) The conformational entropy of Aβ42, estimated via Gibbs entropy, is consistently higher in the 10074-G5–bound form of the peptide for several clustering cut-off values. The conformational entropy was calculated such that the weights, P, of each state correspond to the fractional occupancy as determined by the GROMOS clustering algorithm (34). Error bars represent ± SDs of values calculated from the first and second halves of the simulations in (C) and (D).
