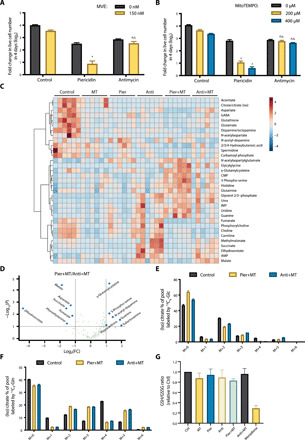
Fig. 2. Combination of mitochondrial complex I inhibition and a mito-antioxidant induces a unique profile of metabolites.

(A and B) Jurkat cells supplemented with pyruvate and uridine were treated with 1 μM piericidin or 1 μM antimycin ± MVE (A) or MitoTEMPO (B) for 4 days, and the population doublings were assessed. n = 5; mean + SEM; *P < 0.0001 compared to piericidin alone; n.s.P > 0.9999 (A), n.s.P > 0.9999 (B; 200 μM), n.s.P = 0.9053 (B; 400 μM) compared to antimycin alone. (C) Heatmap of the metabolites whose abundances were significantly different among Jurkat cells treated with vehicle (Control), MitoTEMPO (MT), piericidin (Pier), antimycin (Anti), piericidin and MitoTEMPO (Pier+MT), or antimycin and MitoTEMPO (Anti+MT) for 24 hours. The relative abundance of each metabolite is depicted as z score across rows (red, high; blue, low) (n = 6, FDR ≤ 0.1). (D) Volcano plot of the metabolites whose abundances were significantly different between Jurkat cells treated with Pier+MT and Anti+MT for 24 hours (dashed line: fold change threshold = 2 and P value threshold = 0.1, n = 6). (E and F) Jurkat cells treated with vehicle (Control), Pier+MT, or Anti+MT for 24 hours were labeled for 8 hours with [U-13C6]glucose (E) or [U-13C5]glutamine (F), and the percentage of labeled (iso)citrate pools was assessed (n = 5, mean + SEM). (G) GSH/GSSG ratio in Jurkat cells treated with vehicle (Control), MT, Pier, Anti, Pier+MT, Anti+MT, or menadione for 24 hours (n = 4, mean + SEM).
