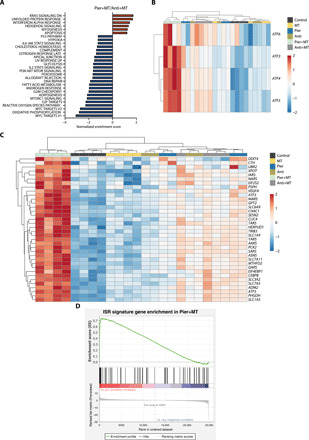
Fig. 4. Combination of mitochondrial complex I inhibition and a mito-antioxidant induces a robust ISR.

(A) Gene set enrichment analysis of top gene signatures that are up-regulated (red) or down-regulated (blue) in Jurkat cells treated with Pier+MT compared to Anti+MT for 24 hours. n = 4; FDR ≤ 0.05. (B) Heatmap of unsupervised clustering, representing ATF transcripts in Jurkat cells treated with vehicle (Control), MT, Pier, Anti, Pier+MT, or Anti+MT for 24 hours. The relative abundance of each transcript is depicted as z score across rows (red, high; blue, low) (n = 4). (C) Heatmap of unsupervised clustering, representing ISR signature genes whose abundances were significantly different between Jurkat cells treated with Pier+MT and Anti+MT for 24 hours. The relative abundance of each transcript is depicted as z score across rows (red, high; blue, low) (n = 4; FDR ≤ 0.05). (D) Gene set enrichment analysis of the ISR signature genes in Jurkat cells treated with Pier+MT for 24 hours (n = 4).
