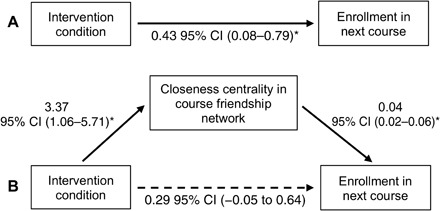
Fig. 3. Mediation analysis.

Path diagram with point estimates (posterior means) of effect parameters and associated 95% credible intervals, using Bayesian estimation with default settings in Mplus (uninformative priors and two Markov chain Monte Carlo chains). Reported ppositive-effect values indicate the probability that the effect is not greater than 0 so can be interpreted similarly to a one-tailed P value. This model controls for baseline closeness centrality, but results do not differ meaningfully when the baseline covariate is omitted. (A) The total effect of intervention condition on enrollment in the next course was 0.43, SE = 0.18, 95% CI (0.08 to 0.79), Ppositive-effect = 0.008. (B) There was an indirect effect of intervention condition on enrollment in the next course through closeness centrality at the end of the semester [estimated effect of 0.13, SE = 0.06, 95% CI (0.04 to 0.28), Ppositive-effect = 0.003], while the 95% credible interval for the direct effect dropped to include 0 [estimated effect of 0.29, SE = 0.18, 95% CI (−0.05 to 0.64), Ppositive-effect = 0.05]. This suggests that the greater likelihood of affirmed students taking the next biology course was, in part, explained by affirmation-induced increases in closeness centrality in the course friendship network: Closeness centrality at the end of the semester explained 31% of the variance in the effect of intervention condition on enrollment in the next course.
